Region
Core

Inner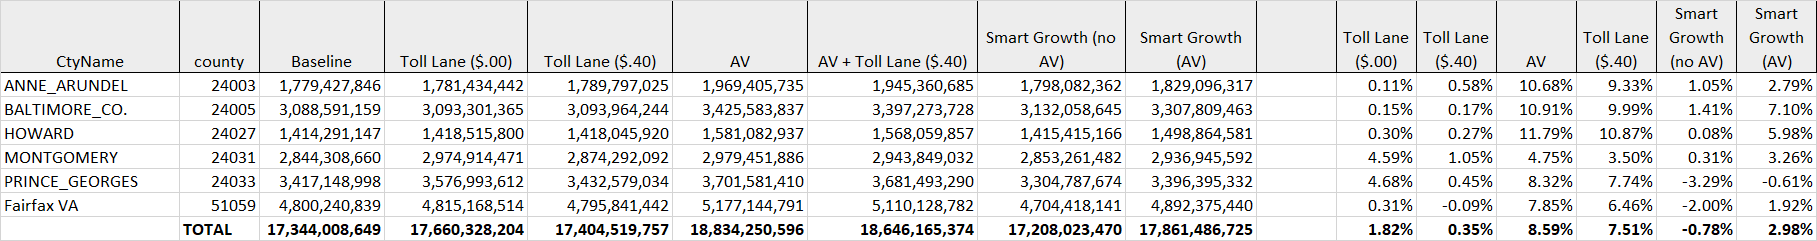
Outer
Total MSTM + SILO
Core MSTM + SILO
Inner MSTM + SILO
Outer MSTM + SILO
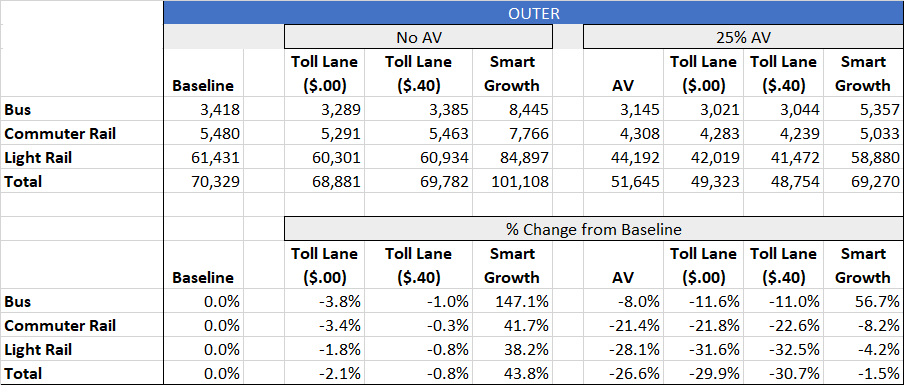
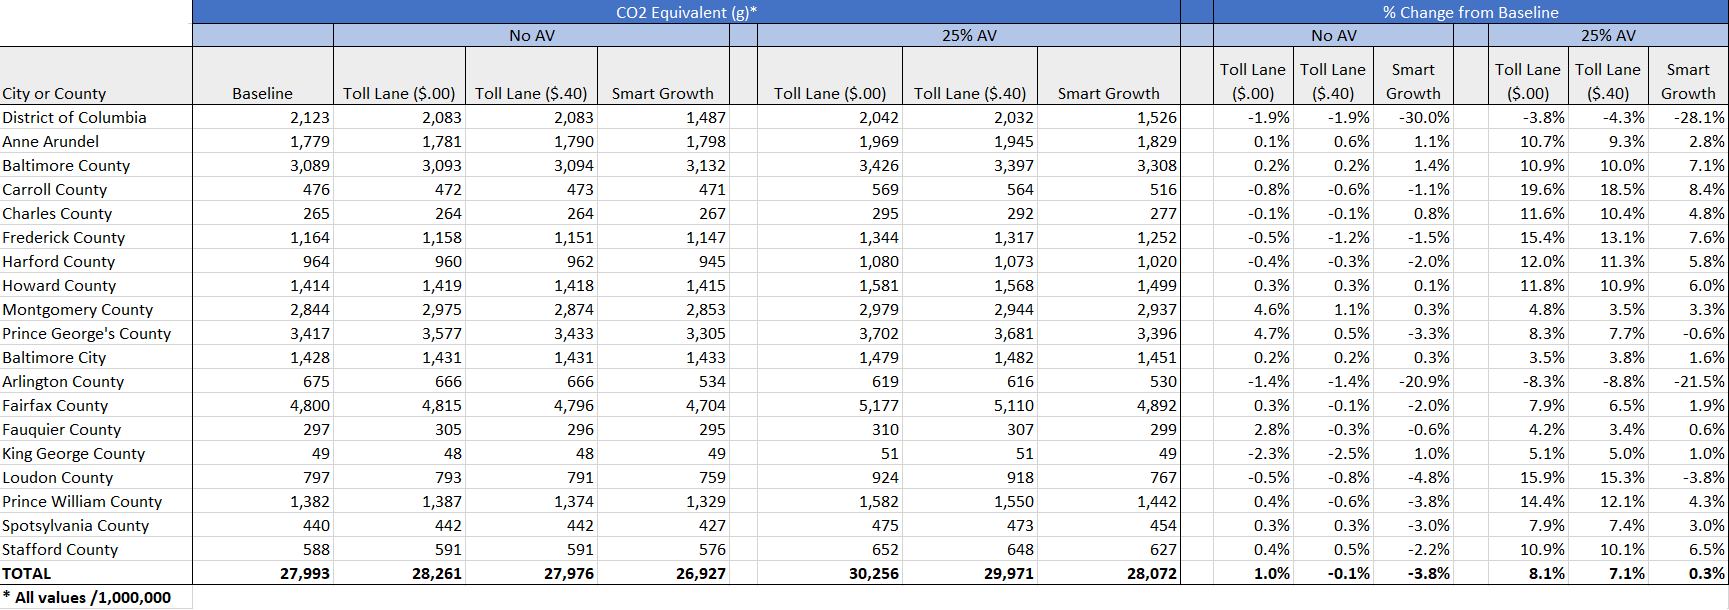
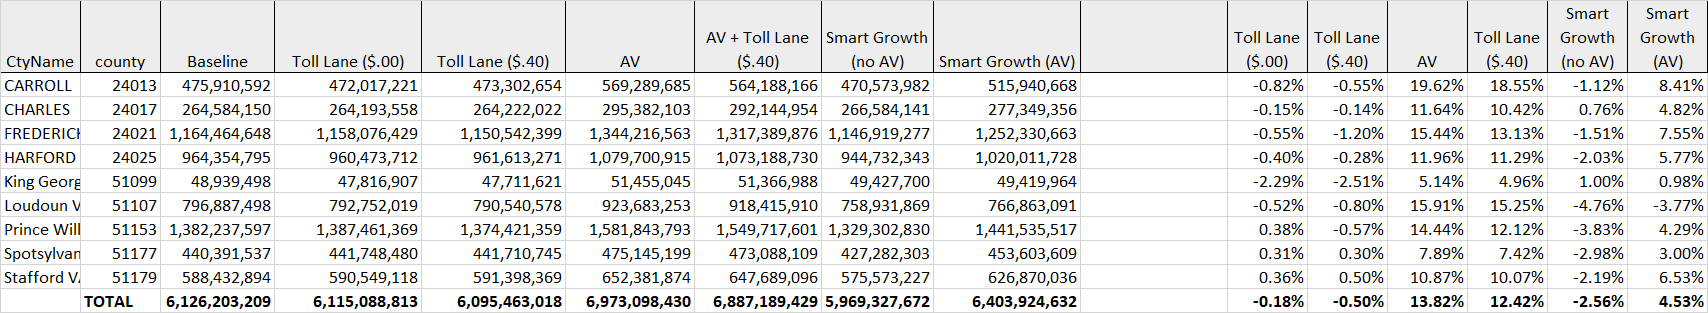
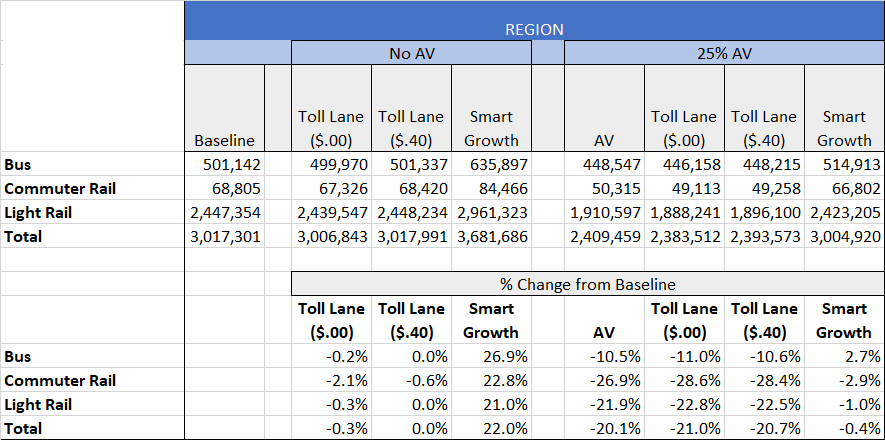
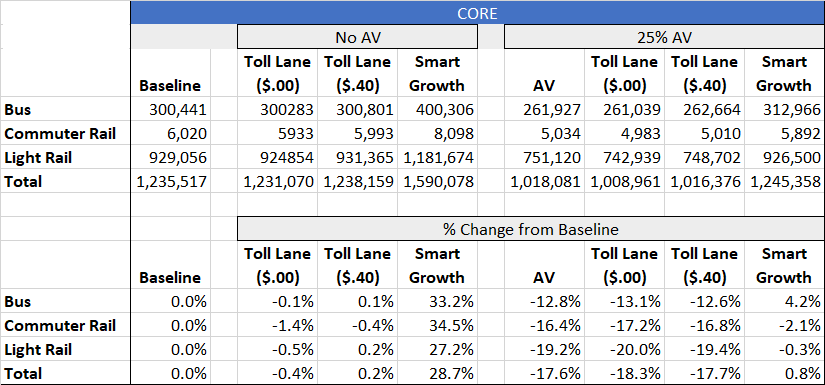
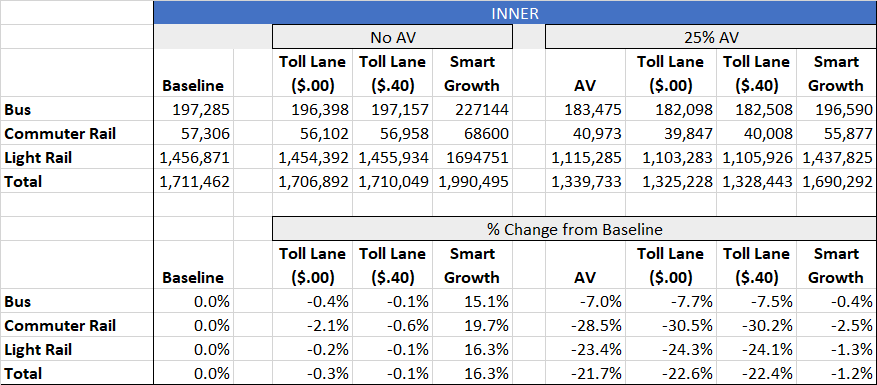
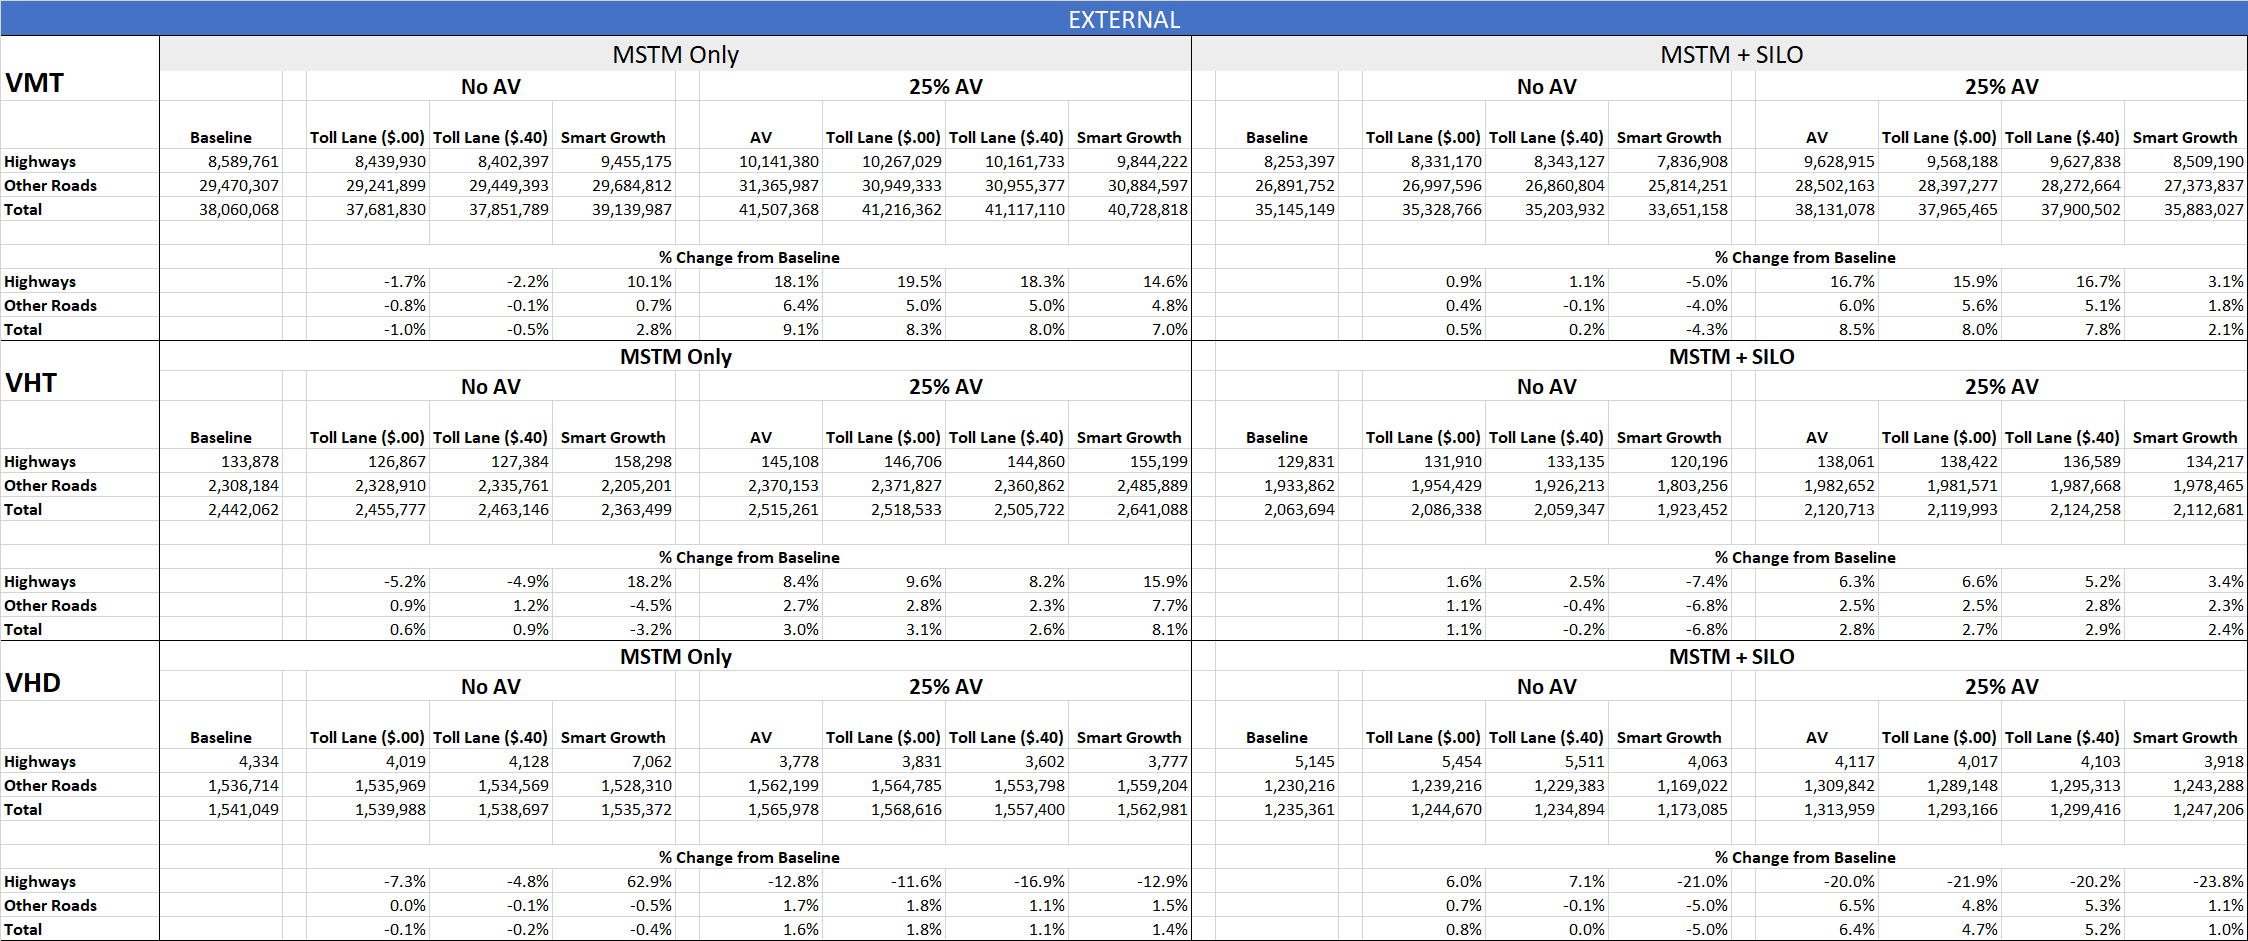
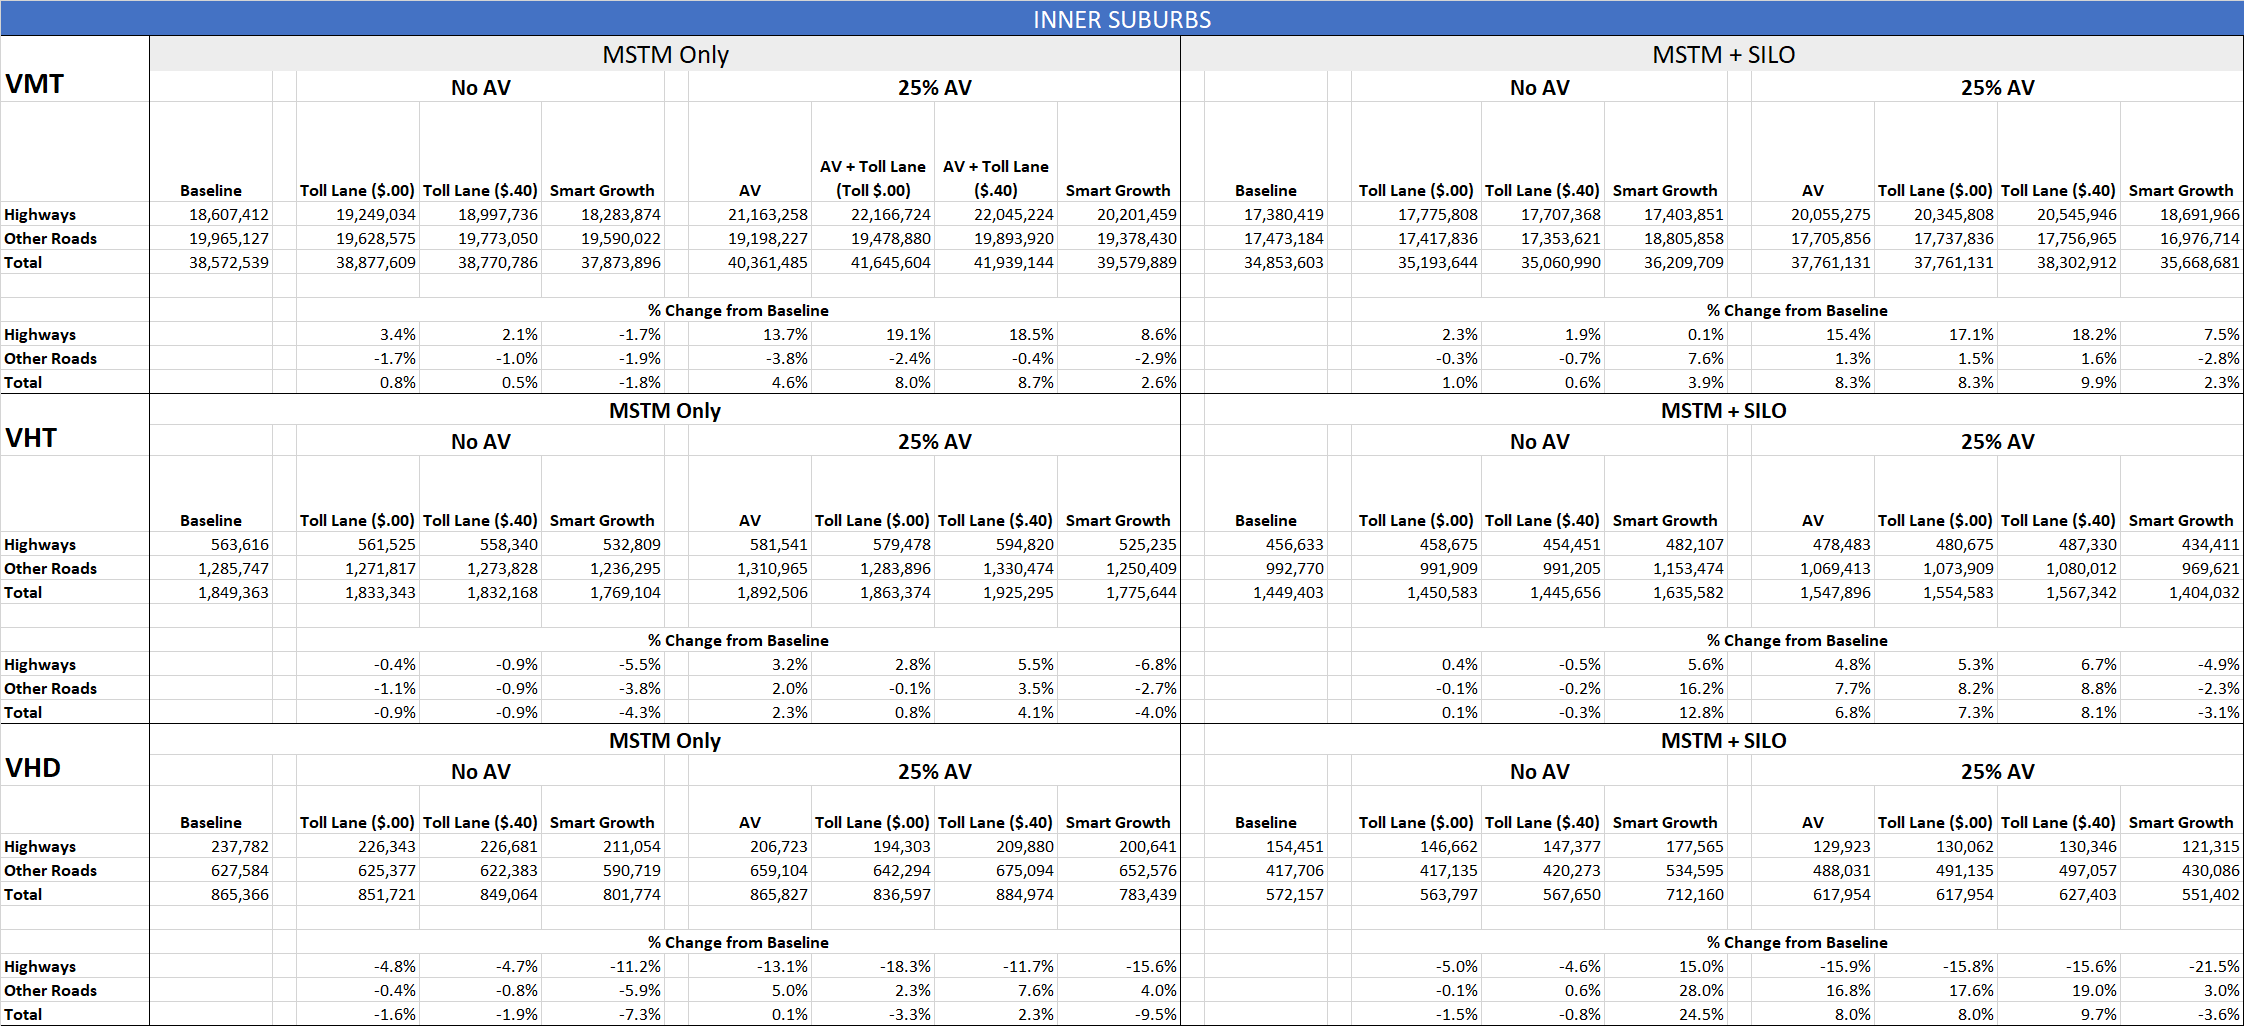
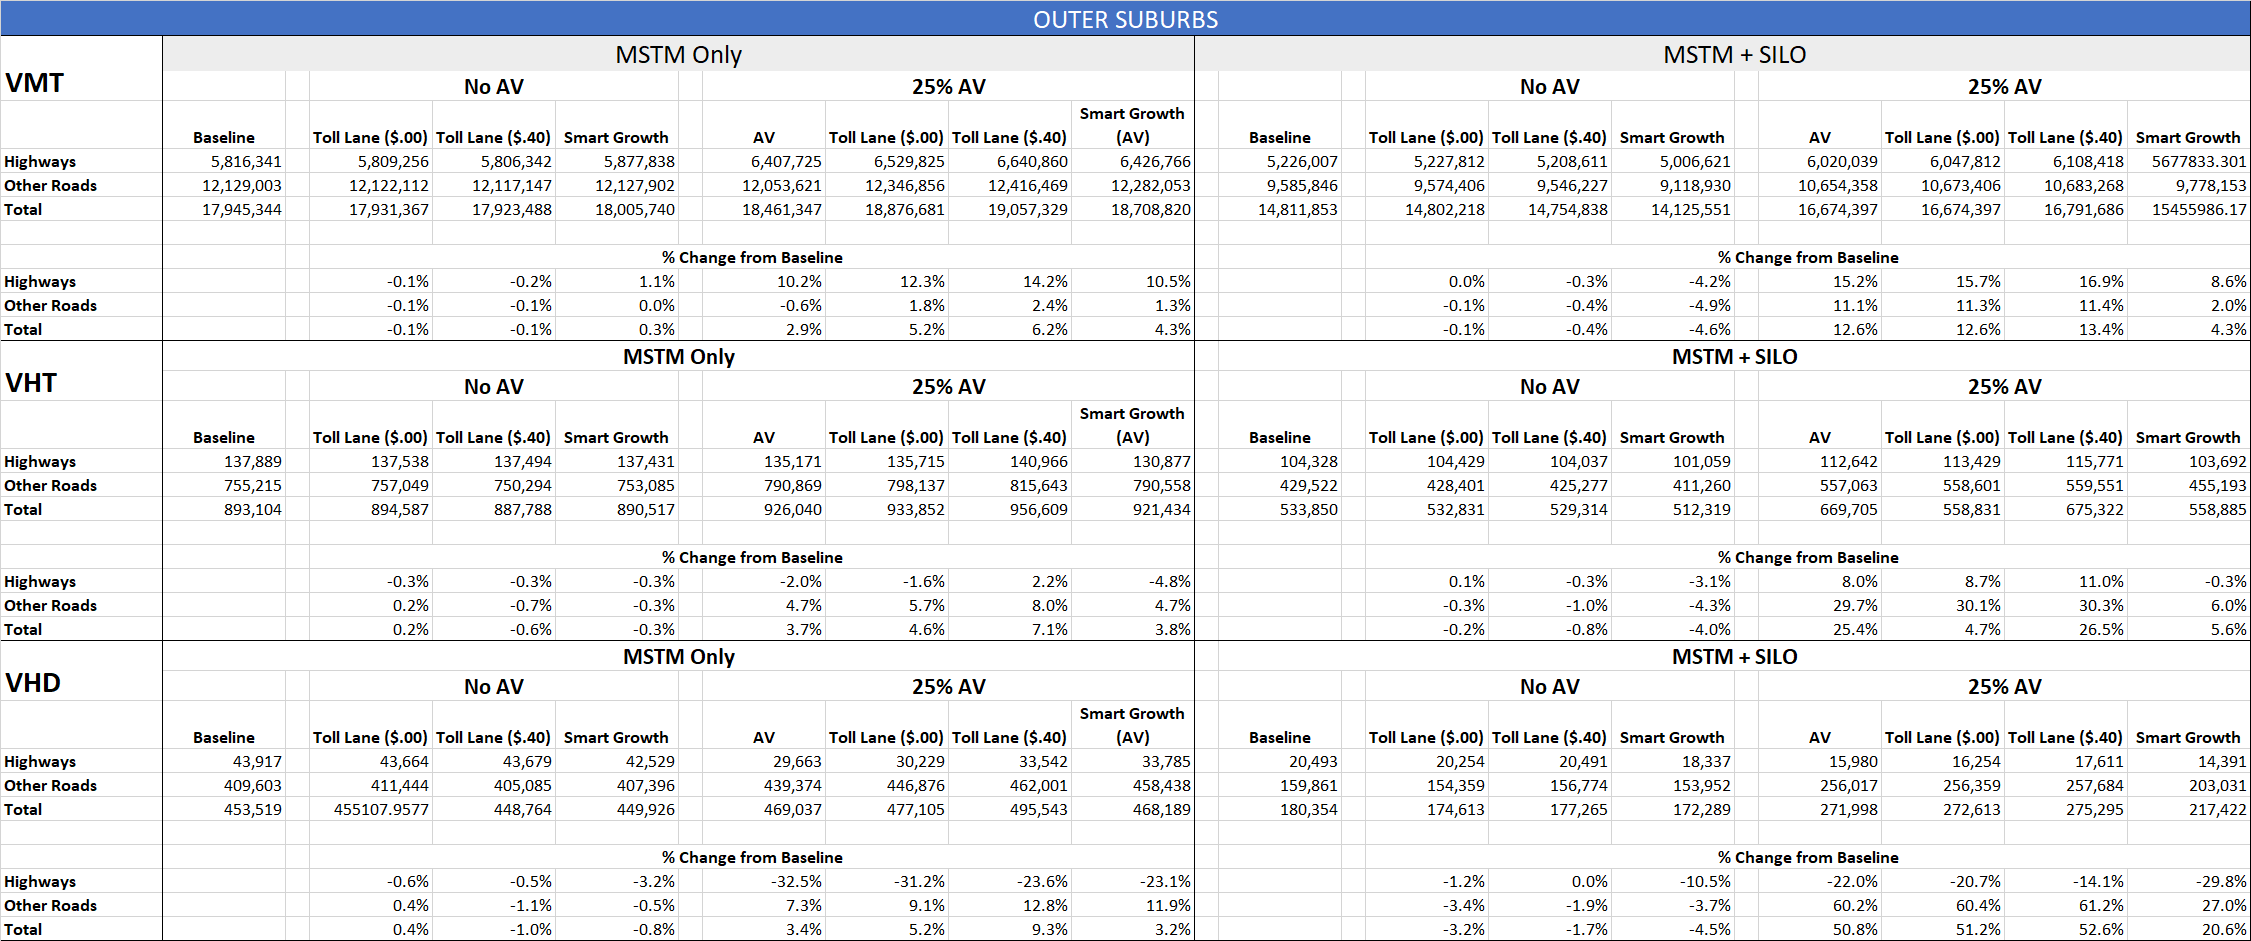
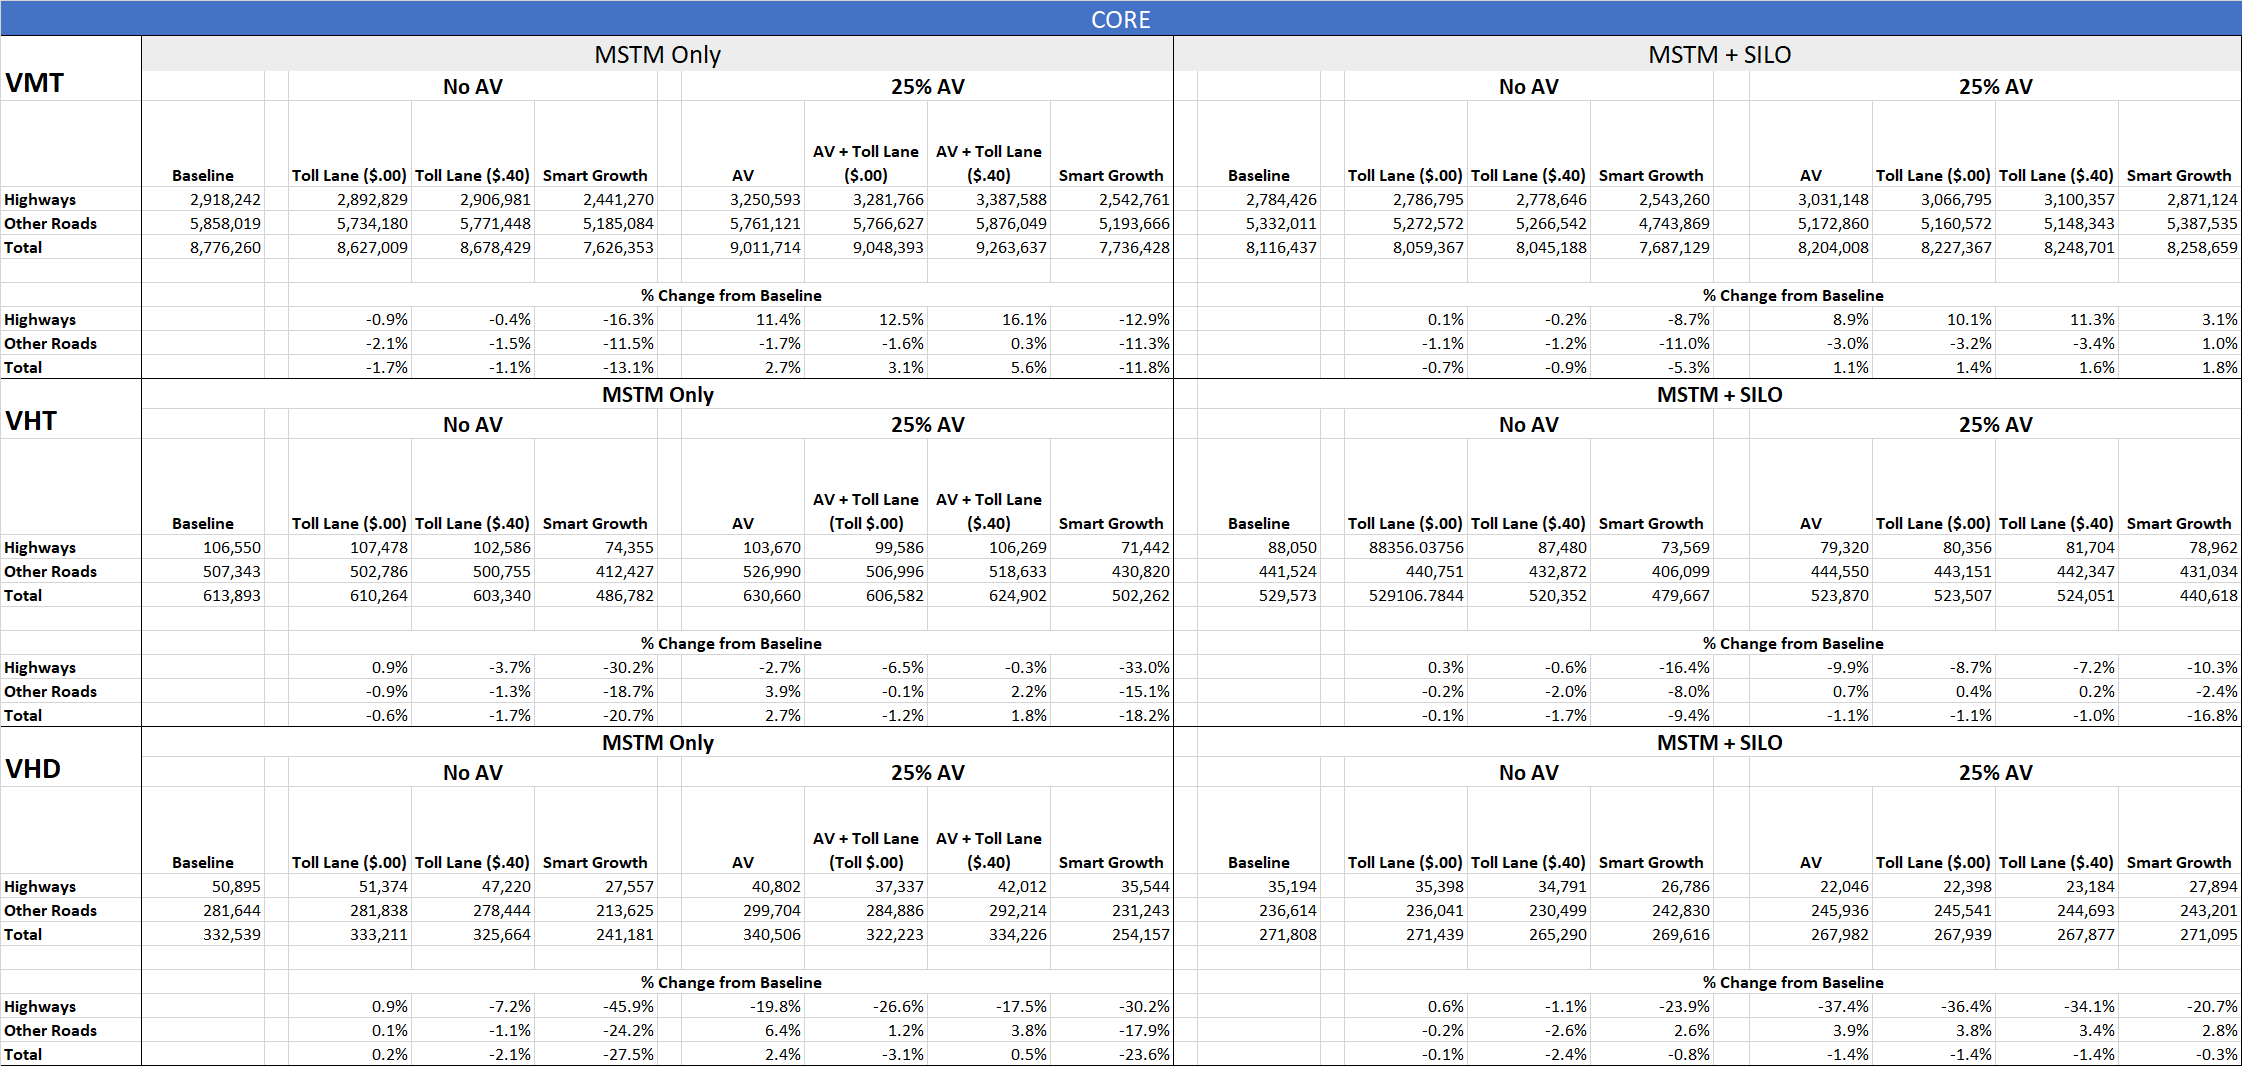
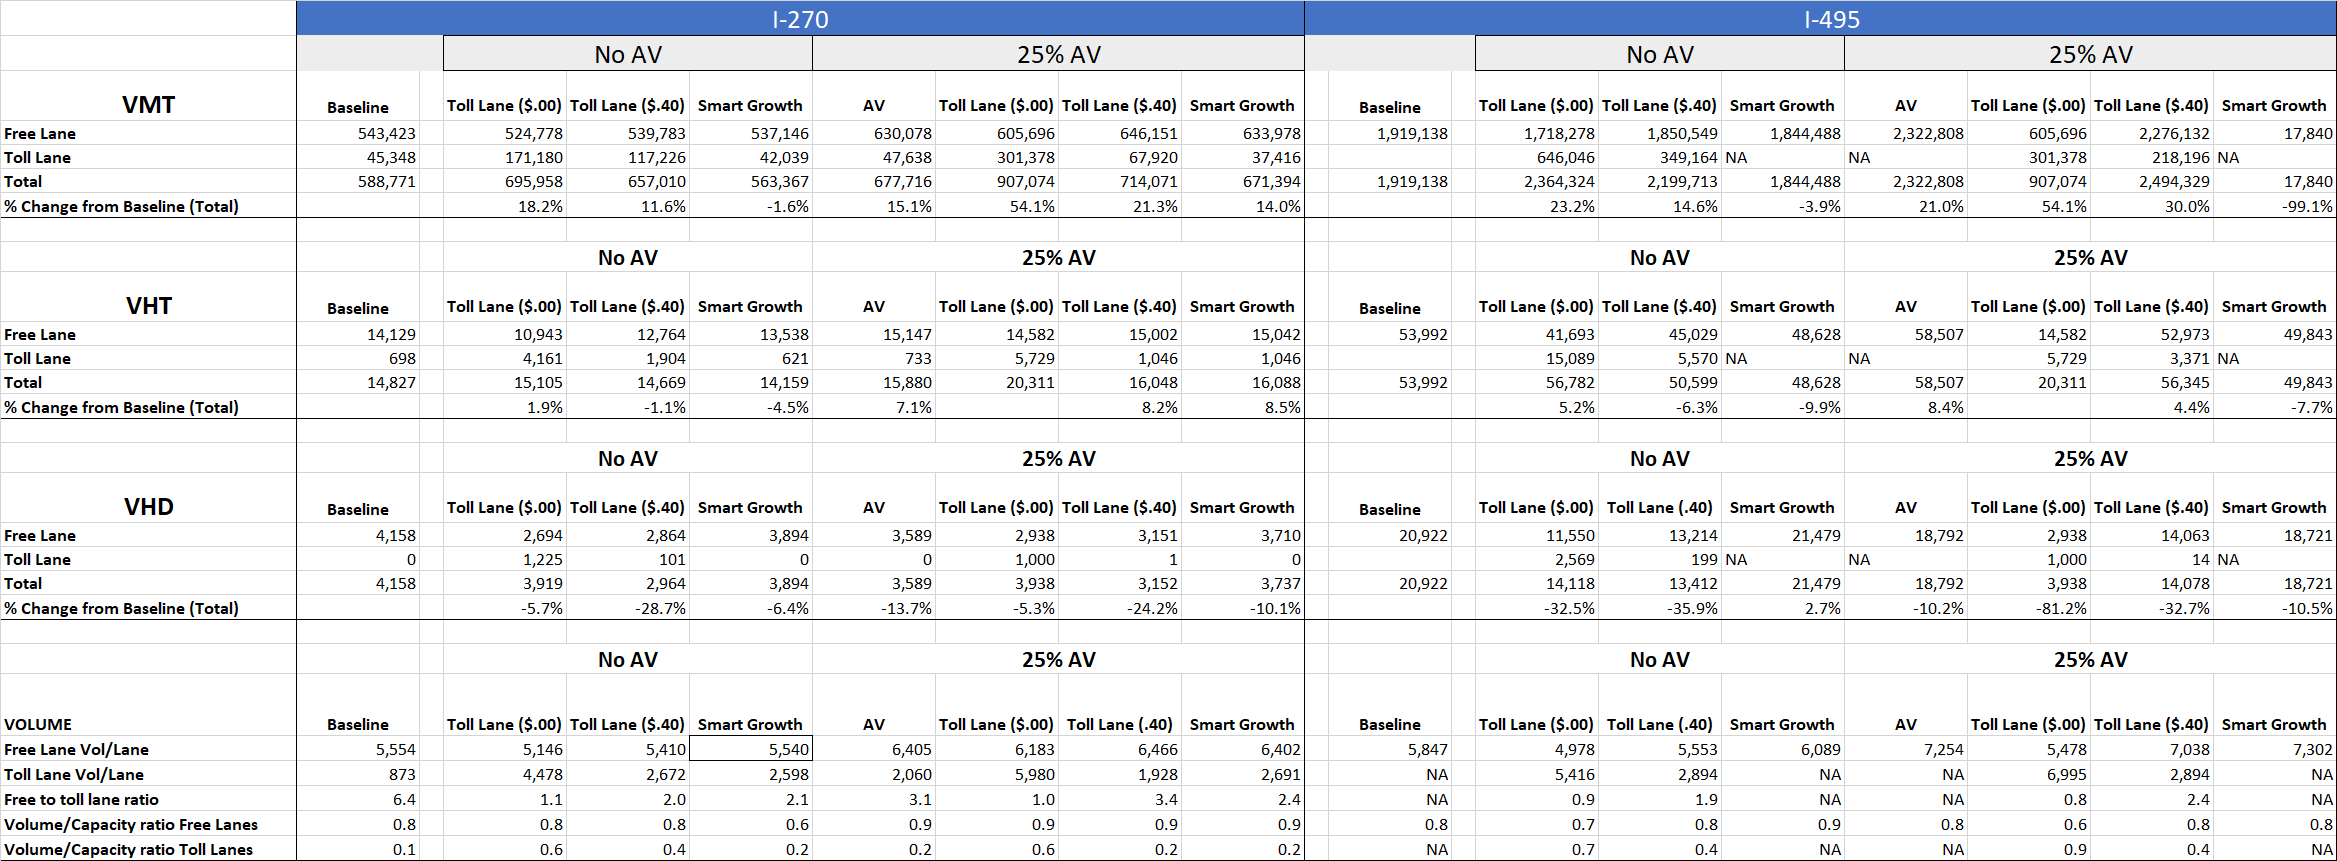
The following tables present the full datasets for travel related indicators for this study. The MSTM Only results are from using only the four step travel model. The MSTM + SILO results reflect outcomes from running the travel model and land use model interactively to capture the population shifts that respond to changes in accessibility and other features of SILO (see website description of SILO).
The results include some data not shown in the report: Toll Lane ($.00) show results for adding the four lanes without any tolls applied in both the Non AV and 25% AV conditions. Toll Lane ($.40) show the results with the toll applied, which are presented in the report.
Region
External
Inner
Outer
Core
I270 I495
REGION
CORE
INNER
OUTER
Total MSTM + SILO
CORE MSTM + SILO
INNER MSTM + SILO
OUTER MSTM + SILO
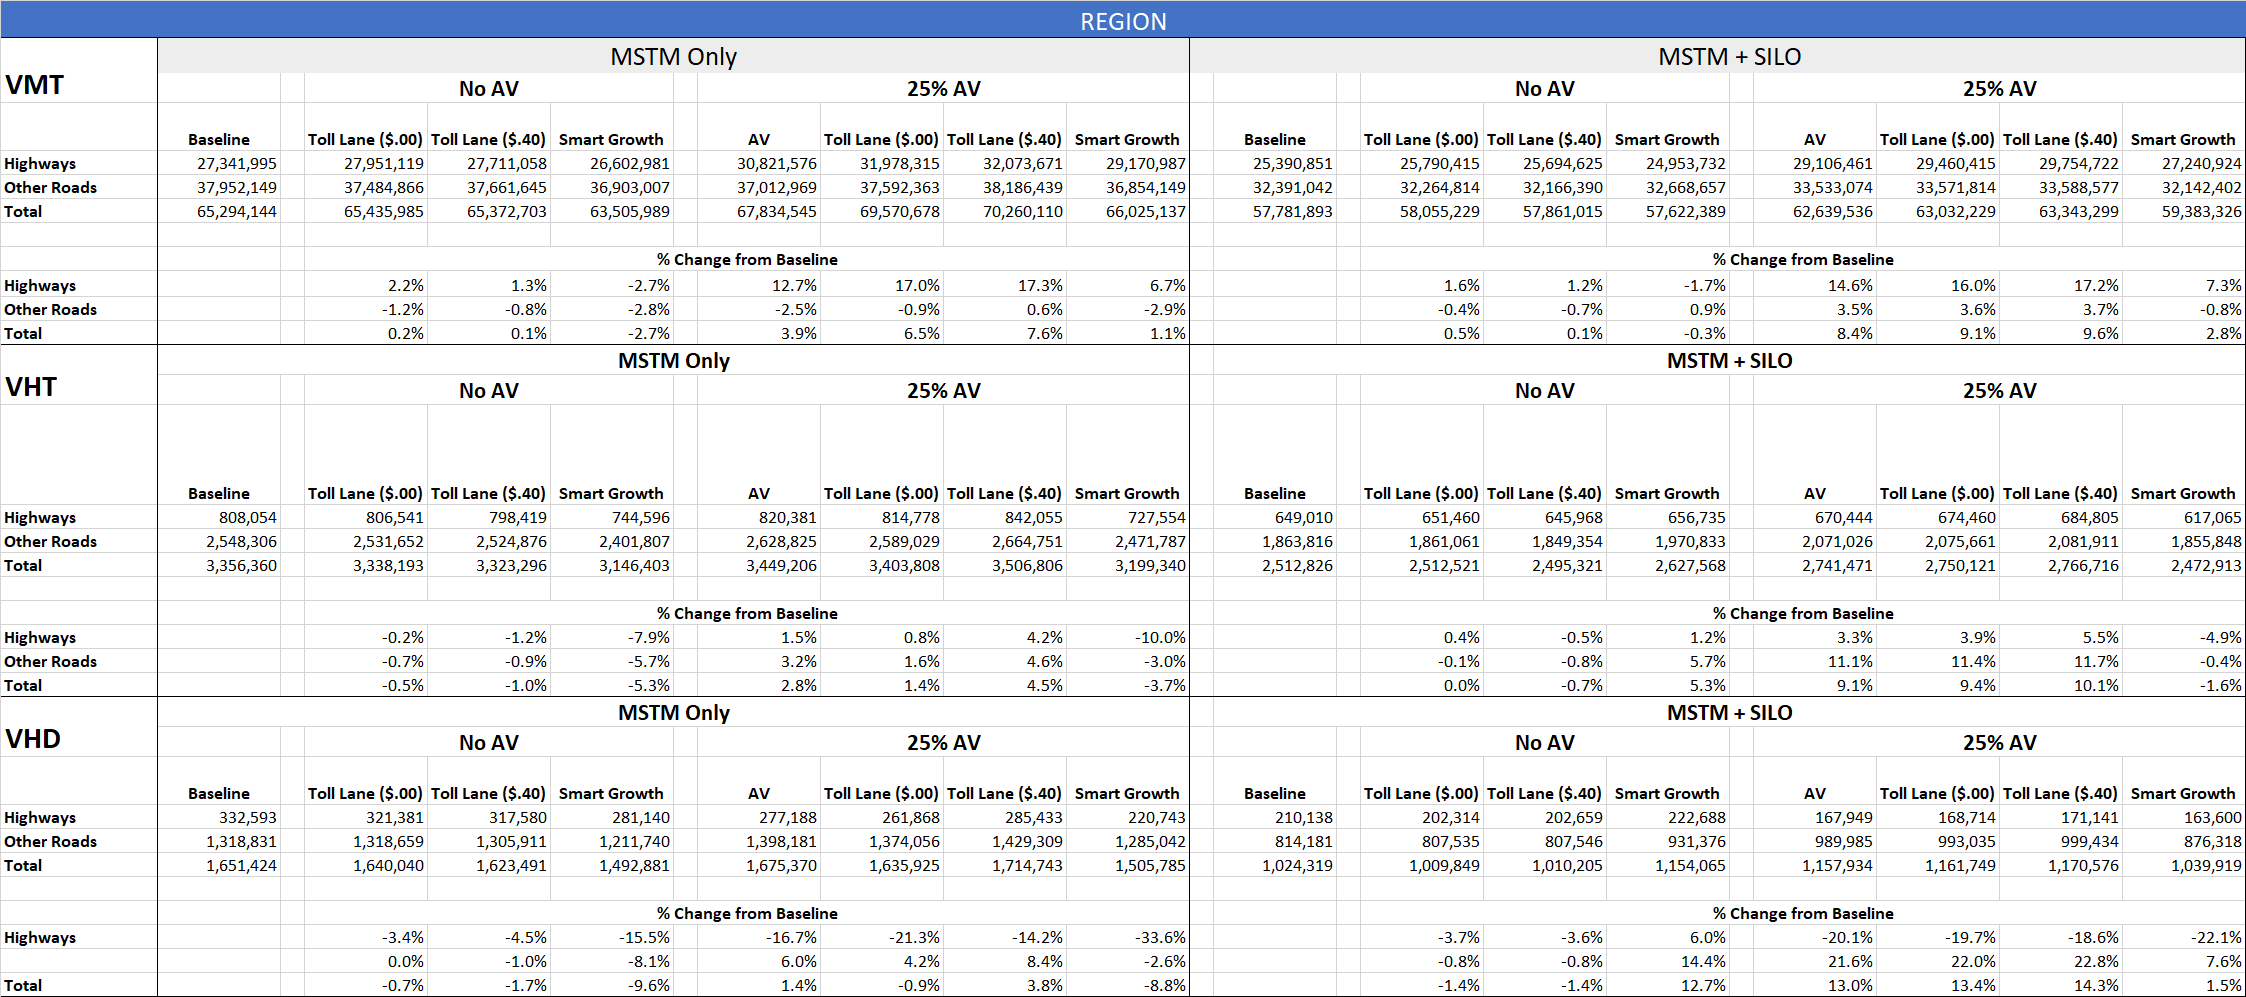
The following tables present the full datasets for travel related indicators for this study. The MSTM Only results are from using only the four-step travel model. The MSTM + SILO results reflect outcomes from running the travel model and land use model interactively to capture the population shifts that respond to changes in accessibility and other features of SILO (see website description of SILO). The results include some data not shown in the report: Toll Lane ($.00) show results for adding the four lanes without any tolls applied in both the Non AV and 25% AV conditions. Toll Lane ($.40) show the results with the toll applied, which are presented in the report.
REGION
EXTERNAL
INNER
OUTER
CORE
I270 I495