News

PALS 2024-2025: Year In Review

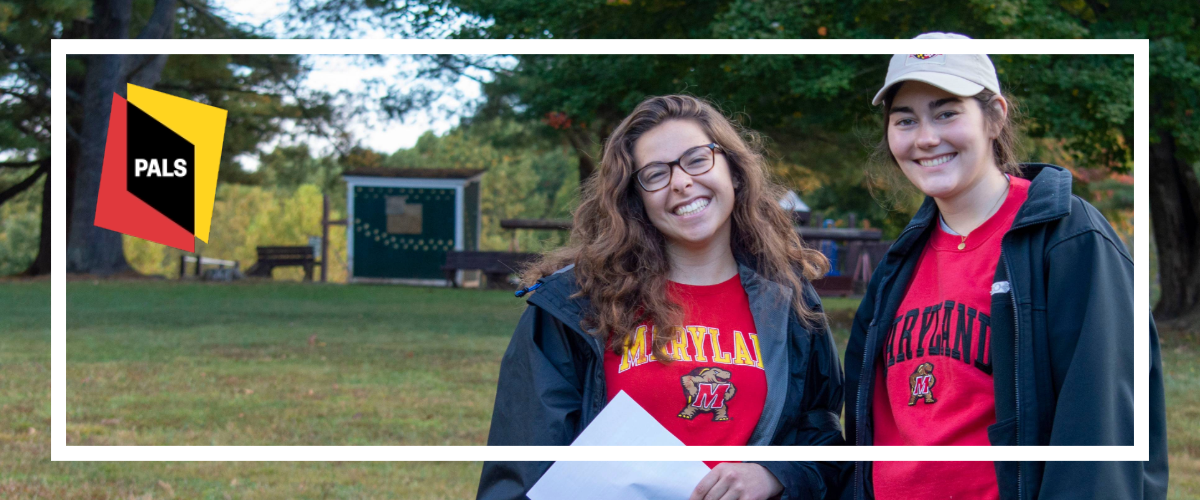
NCSG’s Partnership for Action Learning in Sustainability (PALS) connects the experience of UMD faculty and the creativity of UMD students with government, non-profit, and community partners to solve real-world problems. Each academic year, PALS works to match partner jurisdictions, agencies, and other organizations with relevant university coursework. Since 2014, PALS has connected 2,400 UMD students to more than 300 projects across the state of Maryland. 

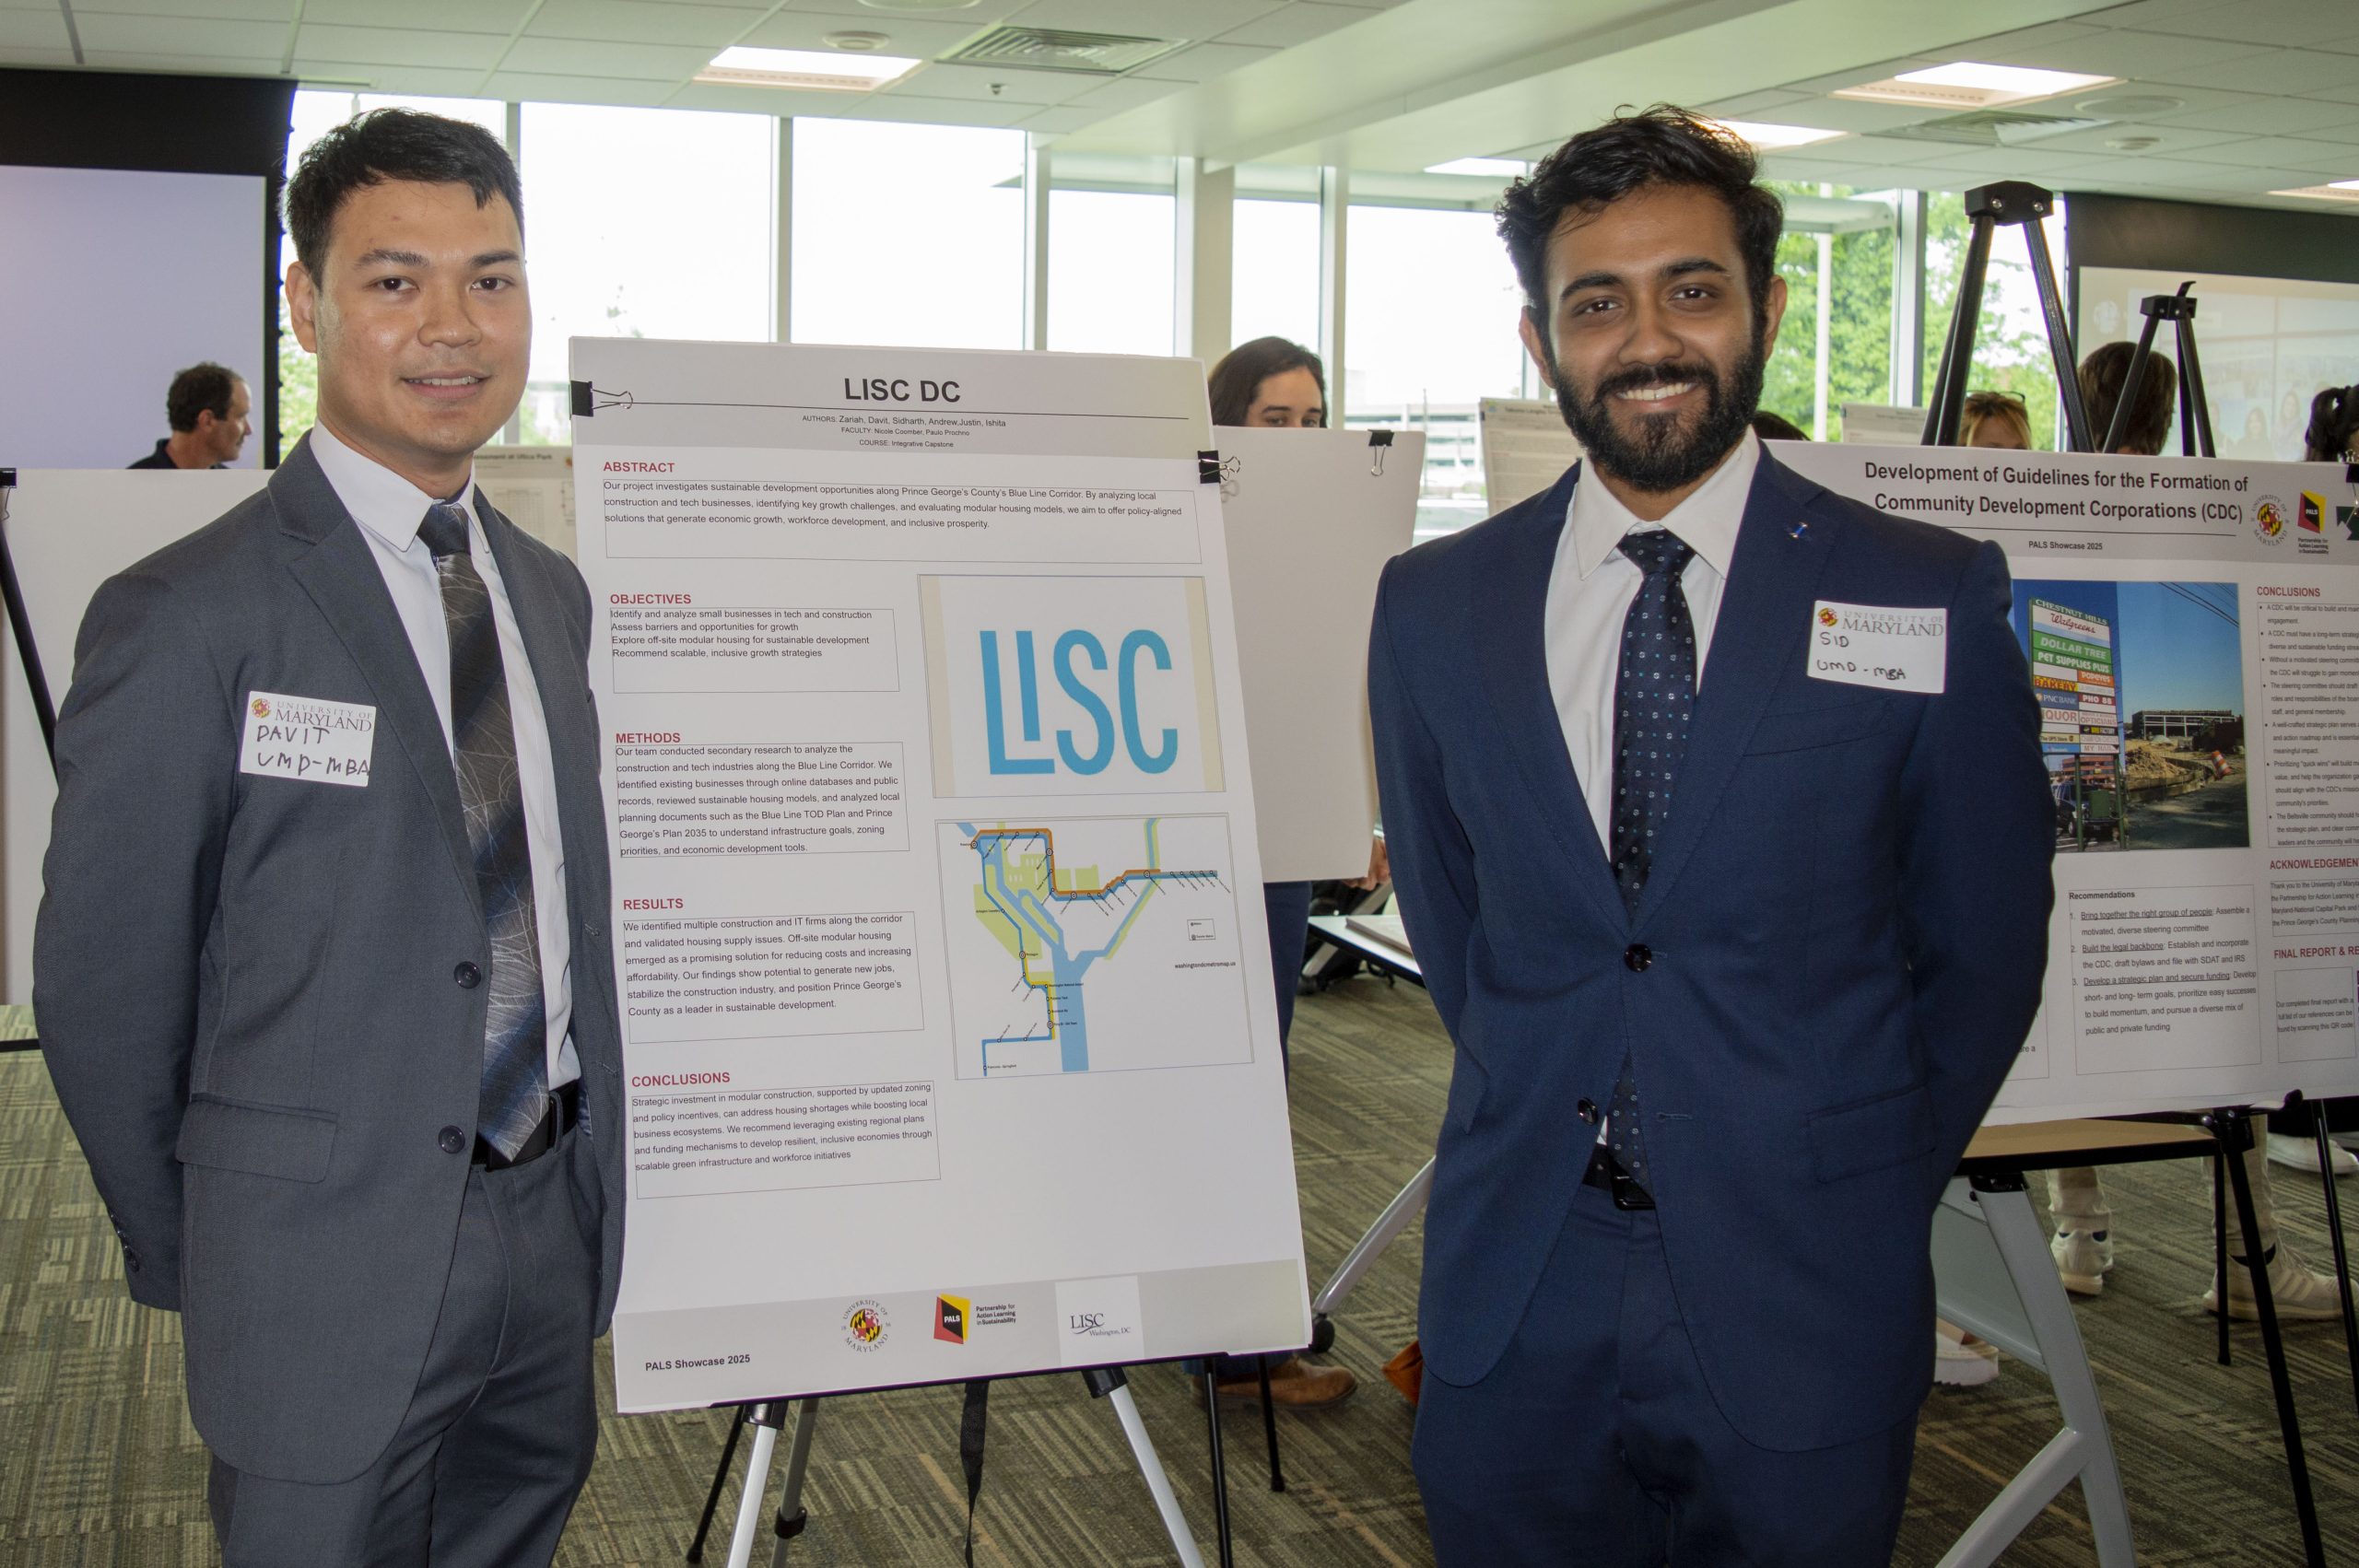
This academic year, PALS completed 34 projects. These projects ranged from a middle housing policy study for Maryland to a paper that examines changes in Korean population trends in Beltsville, Maryland, and Prince George’s County, Maryland (both by the School of Public Policy) to an assessment and forecast of 911 service demand by the Robert H. Smith School of Business (final report forthcoming). In addition to a final presentation and a report to the client, students and faculty participate in an annual showcase in May that is open to the public. 

UMD students presenting their PALS project, Live! From Prince George’s County: Exploring the History of Music and Place, a historical analysis of live music venues in Prince George’s County.

The collaborative university-community partnership delivers recommendations, strategies and tools to address a community’s most pressing challenges, providing a road map for creating sustainable, thriving places to live, work and play. In the 2024-2025 academic year, PALS worked with 21 partners on 45 projects. This year’s partners include: 

  • Brookeville, Maryland
  • Cecil County
  • College Park Department of Planning & Community Development
  • College Park, Maryland
  • Community Forklift
  • Defensores de la Cuenca
  • Evensong Natural Building Lab
  • Frederick County
  • Frederick County Division of Parks and Recreation
  • Local Initiatives Support Corporation
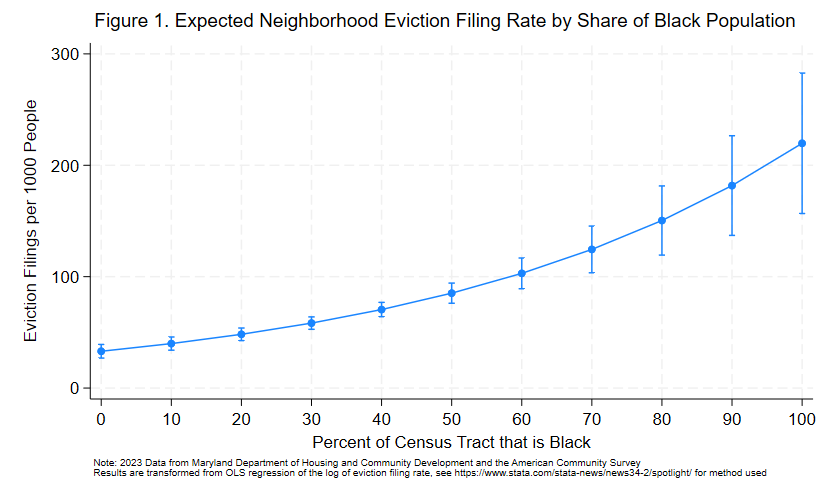
  • Maryland Department of Housing and Community Development
  • Maryland Department of Natural Resources
  • Maryland Department of Planning
  • North Beach, Maryland
  • Prince George’s Community College
  • Prince George’s County
  • Prince George’s County Department of Parks and Recreation
  • Prince George’s County Department of Planning
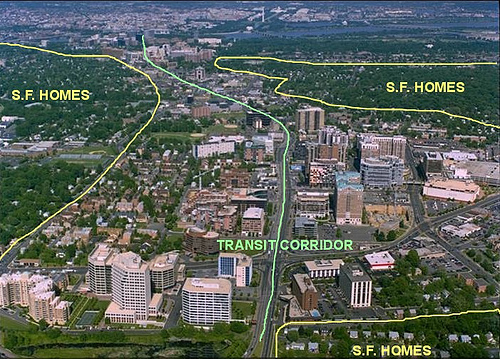
  • Purple Line Corridor Coalition (PLCC)
  • Resilience Authority of Anne Arundel and Annapolis
  • Terps for Bike Lanes


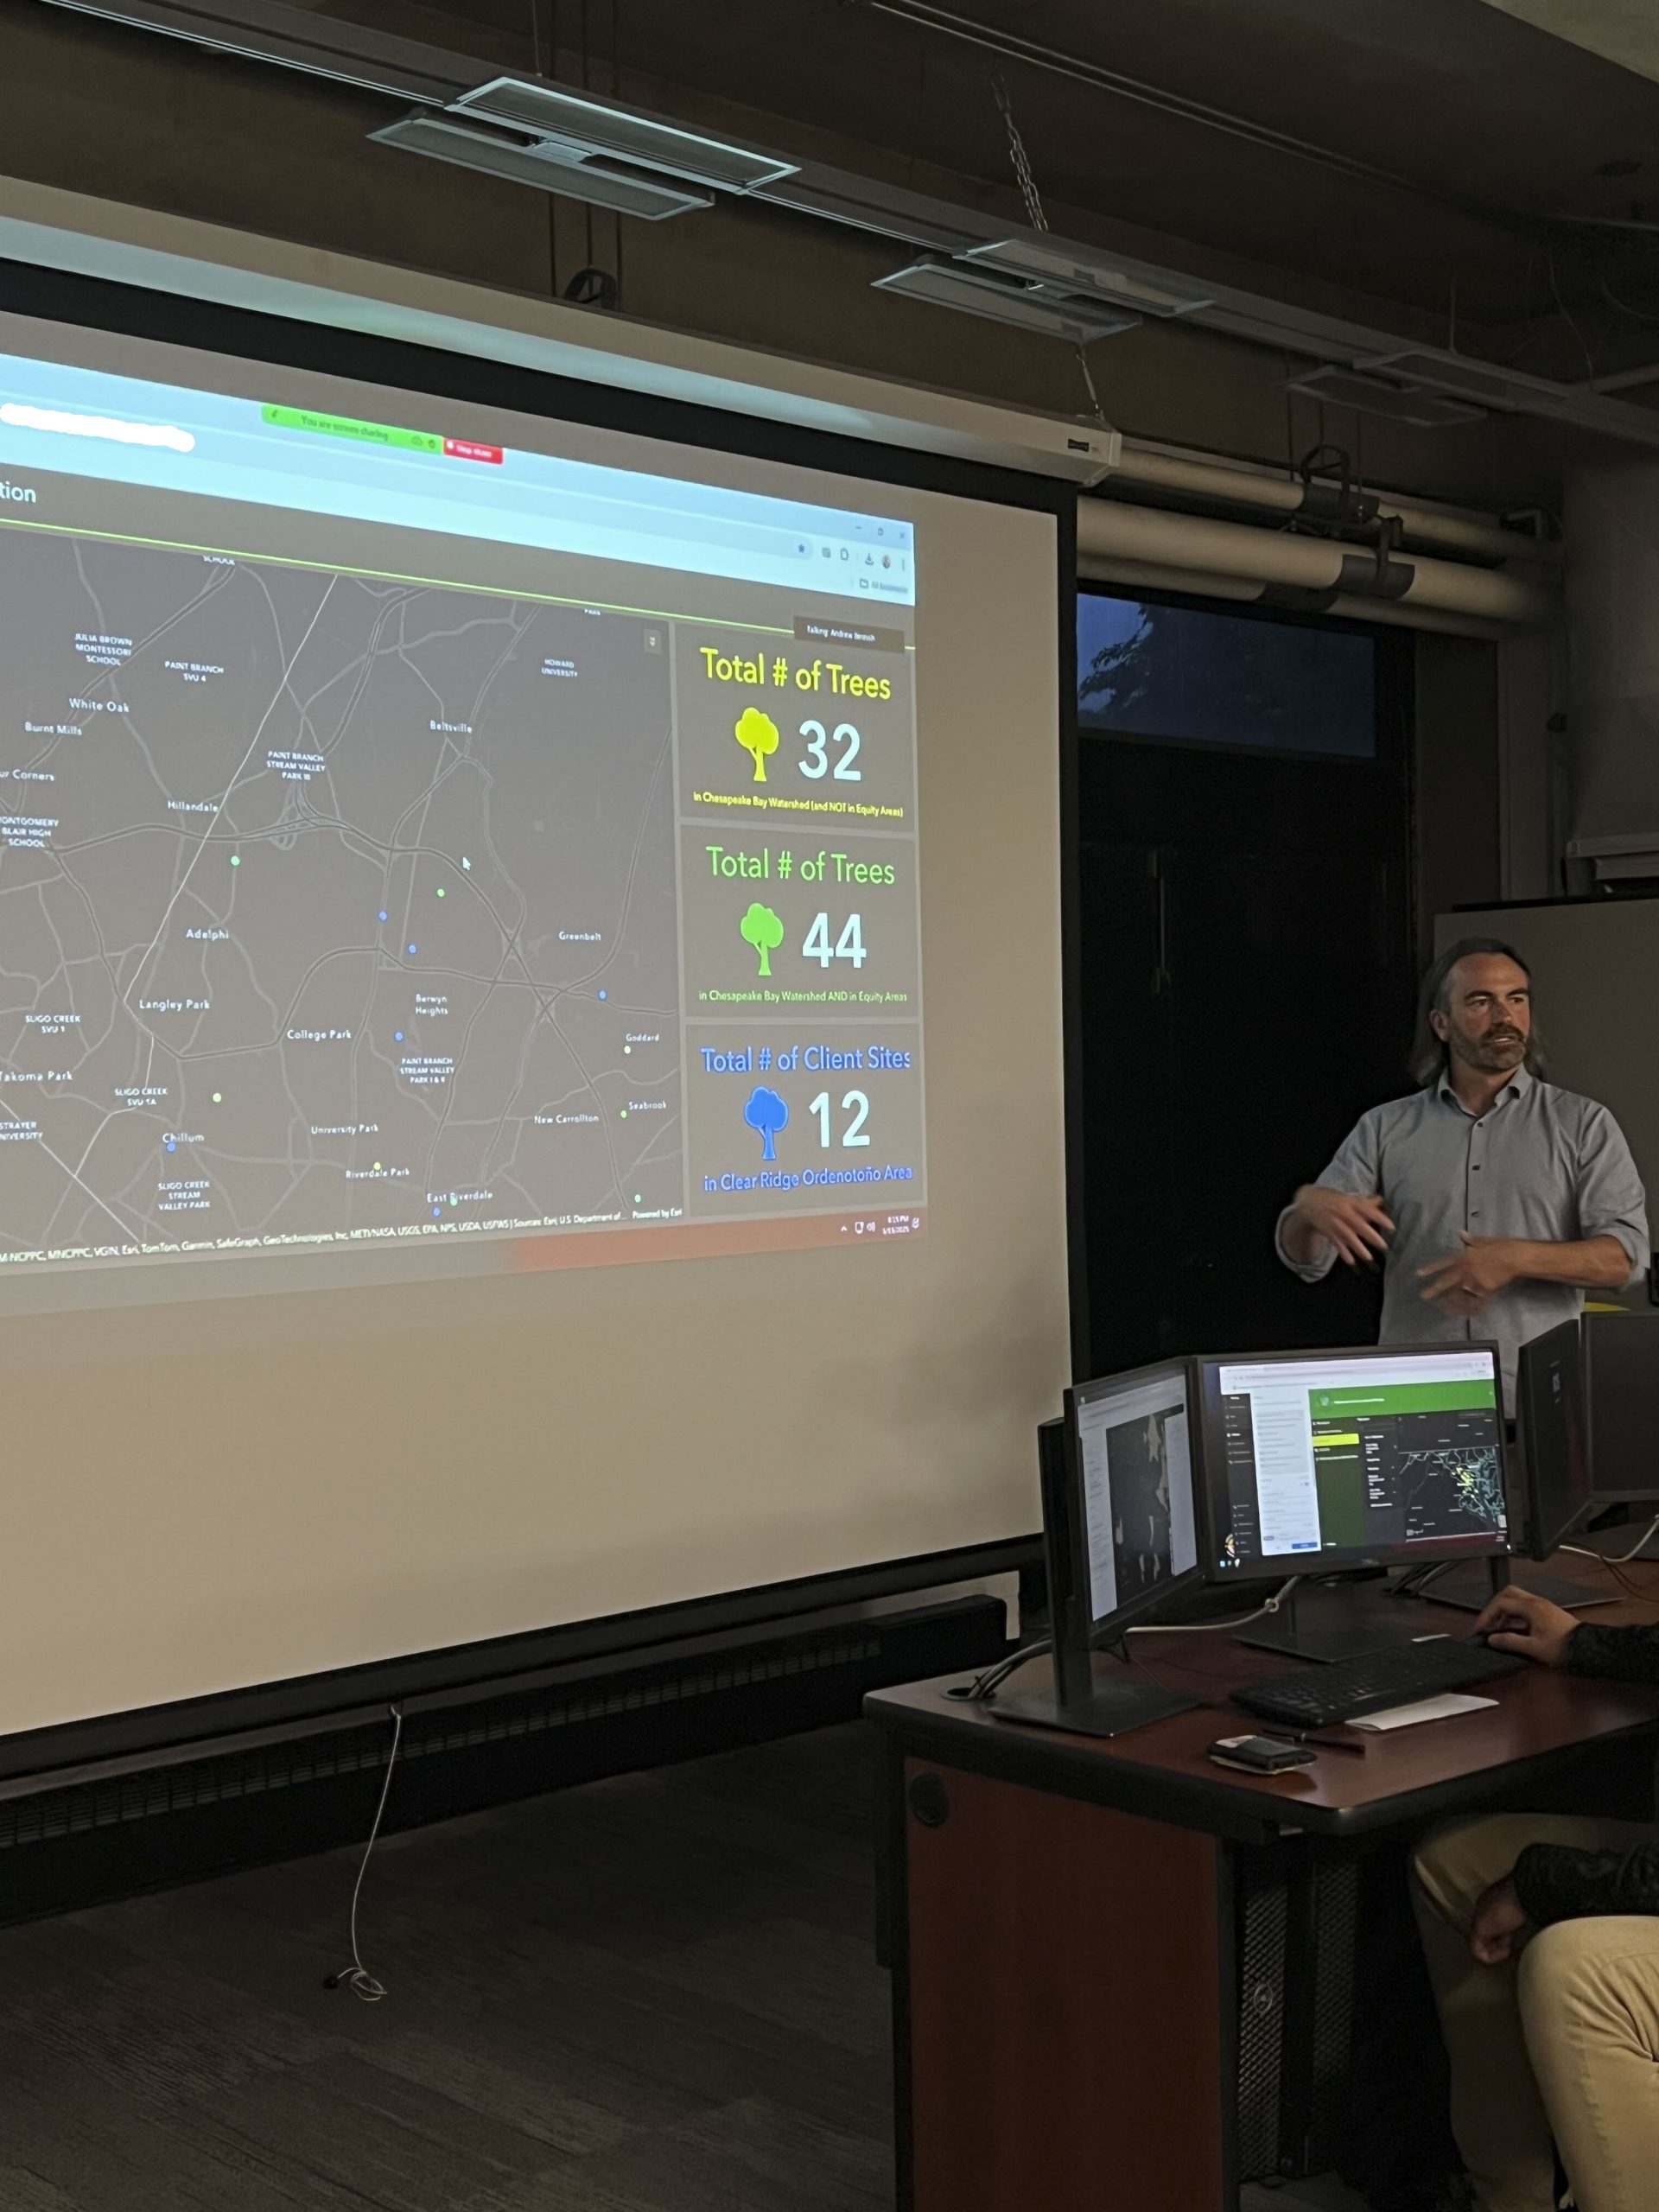
Presentation on PALS project, Defensores De La Cuenca Interactive Web App, supporting environmental stewardship in the Chesapeake Bay watershed.

In the 2024-2025 PALS Survey, partners reflected on their experience…

“We’ve worked with PALS in the past and have always enjoyed how enthusiastic and engaged the students are and how helpful they are in answering any questions we have as part of the analysis of their data.  They take the time to understand any goals or outcomes we are specifically looking for and try to accommodate those.  It has been a very successful project each time.”

“It was a complicated project with many moving parts, and the final result exceeded expectations. It could not have been possible without students’ input and labor and faculty leadership.”

“The students were very knowledgeable of the subject and provided great feedback.”


In the same survey, students shared….

“I think the aspect of the project that was most successful was that the client seemed excited to be able to potentially implement our recommendations because that means the work we did was data-driven and can have a real impact on Frederick County.”

“This project was an excellent opportunity to see how impactful our work in the university is for the community. Sometimes what we learn in the classroom seems abstract and very specific for only certain purposes, but having the possibility to apply what we learned in class to contribute to the understanding of the structure of the dune in Assateague State Park and how that can help direct efforts to protect both the dune and the infrastructure of the park was great!

“I realized that I like working on smaller-scale projects that directly impact the community. It is great seeing all our hard work come to life in an event that brought joy to the community.” 


Lastly, faculty commented…

“Working on these projects has generated research ideas and opportunities for me. I have developed research projects, written papers and book chapters, and presented materials derived from PALS projects at national and international conferences.”

“It was fabulous to be able to offer students a living, breathing, ready-made experience of community to supplement our activities inside the classroom and their readings and assignments at home. It’s one thing to learn “about” community from discussions and textbooks; learning “with” and “from” community takes all of that to a new level!”

“The students were inspired to learn by serving the community.”


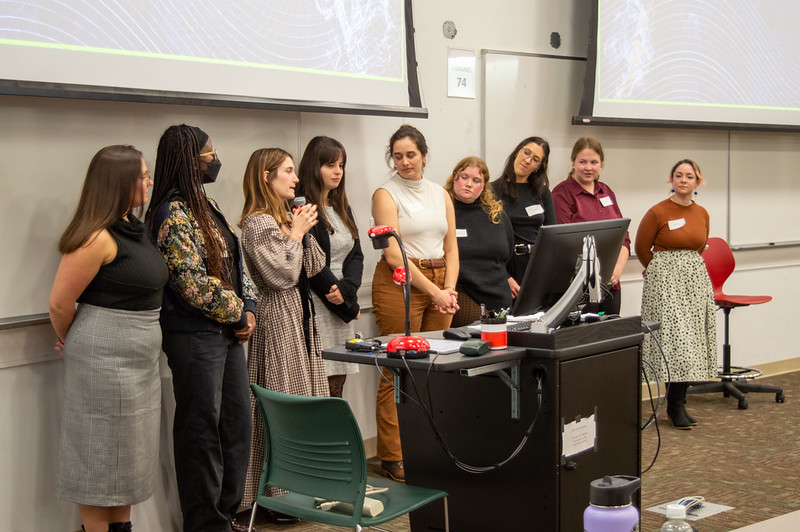
Students sharing their PALS project at the 2024-2025 showcase. 

This spring semester, PALS hosted its annual showcase, where students shared their work at a public event with experts, practitioners, and community members in attendance. Images from the 2025 showcase can be found at https://flic.kr/s/aHBqjCdXof.


Read More

Research Paper on Racial Neighborhood Context of Eviction Filing Rates in Maryland

By Lear Burton, Doctoral Student (bio)

Click here to read the full paper. 

Click here to view the summary presentation of the paper.

Despite the scale and seriousness of the issue, eviction has been called a “hidden housing problem” since a lack of data diminishes visibility on the issue (Hartman & Robinson 2004). This has been especially true in Maryland where the full extent of the court-based eviction landscape has been unclear. However, in 2022, Maryland enacted a new law requiring the District Court to collect and report eviction case data for the whole state. The first full year of data was for 2023. Maryland is one of the least affordable states for renters (National Low Income Housing Coalition 2024), and until now, has not had any statewide research done on evictions.

Eviction is a central mechanism that lays bare the exploitation of housing working-class people under capitalism (Deluca 2022, Desmond 2015, Garboden 2023). Landlords, especially ones with large ownership portfolios, use evictions to control and exploit tenants for economic gain (Balzarini & Boyd 2021, Garboden & Rosen 2019, Immergluck et al. 2020, Raymond et al. 2016). Not only does the act of eviction have immediate consequences on an individual’s basic need for housing, it also affects their health (Desmond & Kimbro 2015, Hatch & Yun 2021, Vasquez et al. 2017), the likelihood of future forced displacement (Desmond et al. 2015), and it increases the likelihood of homelessness and lowers future earnings (Collinson et al. 2023). Beyond the outcomes for individuals, eviction shapes neighborhoods by making them less stable and disrupting community and social networks (van Holm & Monaghan 2021).

More than just the acute physical removal of people from their homes, eviction encompasses “the ongoing set of relations between the landlord and tenant that lead sometimes to a formal eviction, but far more frequently to a filing that changes the power dynamic, or an informal eviction” (Deluca and Rosen 2022). Informal evictions are ways that landlords remove tenants outside of the legal system by incentivizing, threating, or doing drastic things like taking off tenant’s doors to pressure them to leave (Desmond 2016, Hartman & Robinson 2003). There is a lack of data on informal evictions, however scholars estimate that for each formal eviction there may be more than 5.5 informal evictions (Gromis & Desmond 2021). Despite its inadequacies, court-based eviction data is useful due to the lack of data on other types of evictions. 

Using 2023 eviction data for the state of Maryland, the current study aims to answer the question: How does neighborhood racial composition (measured three ways in percent of census tract that is Black, Asian, and Hispanic) associate with neighborhood eviction filing rates in Maryland? To answer this question, I first aggregate eviction data by census tract and then combine it with 2023 five-year American Community Survey (ACS) detailing tract level information on demographics and housing characteristics. I then run ordinary least squares regression models to examine the association of neighborhood racial composition and other demographic and housing variables on the log of neighborhood-level eviction filing rate. I define the eviction filing rate as the number of eviction fillings per 1000 people within a given census tract.

I find strong support that in Maryland, higher shares of a neighborhood population that is Black, Hispanic, and Asian were all associated with higher neighborhood eviction filing rates even while controlling for housing markets, socioeconomic status, and neighborhood decline. Neighborhood level socioeconomic variables such as median household income and percent of the tract that is female headed households with children did have significant associations with eviction filing rates, though they did not have a significant mediation effect on any of the race coefficients. 

These findings are in line with past research on eviction, a higher share of Black residents in a neighborhood is associated with higher eviction filing rates (Lens et al. 2020). The current study finds that within Maryland the share of Hispanic residents and Asian residents has a similarly sized positive effect as share of Black residents on the neighborhood eviction filing rate. The association equates to about a 20 percent increase in expected eviction rate for each 10 percent increase in Black, Hispanic, or Asian share of the neighborhood (respectively, and while controlling for the two other racial groups). The association is especially strong and meaningful for share of a neighborhood that is Black, since there are many majority-Black neighborhoods within Maryland. Figure 1 shows the expected neighborhood eviction filing rate by share of the census tract that is Black while controlling for housing market and socioeconomic variables.

Maryland is a particularly compelling case study on racial inequality in housing due to the prevalence of wealthy Black neighborhoods. The two wealthiest majority Black counties in the United States are Charles ($105,087 median income) and Prince George’s ($98,027 median income) Counties in Maryland. The presence of wealthy majority Black neighborhoods in these Counties did not offset the well-observed national trend that a higher share of Black residents in a neighborhood is associated with higher eviction filing rates.

Click here to read the full paper. 

Click here to view the summary presentation of the paper.

Read More

New Interactive Map Featuring Potentially Buildable State-Owned Land Near Transit Stops Across Maryland

By Cole Shultz, NCSG Graduate Assistant 

Click here to view the interactive map.

Introduction 

Just as in the rest of the country, Maryland is experiencing a housing crisis as home and land prices continue to rise faster than incomes. This is caused by the shortage of homes available to residents at all incomes, particularly those with low or very low incomes. This challenge is further compounded by the necessity of a car to access jobs and housing. This auto-oriented environment leads to houses and amenities being widely dispersed, resulting in increasing carbon emissions, environmental degradation, and traffic deaths. The low-density character of housing development has also been associated with higher housing costs, making the affordability crisis worse. Given these myriad issues, planners and state agencies have an understandable interest in finding strategies to rapidly build housing without adding to an over-stretched transportation system. 

Transit-oriented development (TOD) is one such strategy, presenting a viable alternative to sprawl  by pairing denser, more affordable housing with convenient access to public transportation. Typically occurring within a 10-minute walkshed, or approximately 1/2 of a mile, from a transit station, TOD is characterized by mixed-use, dense development which offers residents a variety of transportation options alongside reduced traffic congestion, economically revitalized neighborhoods, and increased affordable housing production, amongst other benefits. TOD has been remarkably successful in the DC metro area, with the Rosslyn-Ballston corridor along the WMATA rail network in Arlington, Virginia having contributed to over 25% of the County’s entire growth between 1990-2000, and currently being home to over 47,000 people and 42 million square feet of commercial space.

Image 1: Aerial View of Rosslyn-Ballston transit corridor. Sourced from the Congress for the New Urbanism (CNU)

Accordingly, it is a well-understood priority by the State of Maryland to advance TOD, and this requires understanding the existing land use character surrounding transit stations in the state. Our research at NCSG has accomplished just that, by using the State Department of Assessments and Taxation (SDAT)’s PropertyView database to create an interactive map of all state-owned land within a 1-mile radius of a transit station. We find significant potential for new development, particularly in the suburban counties of Washington, Montgomery and Prince George’s, owing to that region’s robust rail system, WMATA. We also find notable development potential in Baltimore City and County through partnering with MDOT along the Baltimore Metro Subway and Light Rail Lines.

Methodology

This project originally began with an exploration of the State’s PropertyView System, which laid the groundwork for much of our subsequent analysis. This first step in this exploration was the creation of 1-mile buffers around the 111 different rail transit stations in Maryland, including 26 on the WMATA system, 38 on MARC, 14 on the Baltimore Metro, and 33 on the Baltimore Light Rail, using ArcGIS Pro. Within those buffer zones, properties were then identified and their owners classified to understand land distribution. Properties not determined to belong to either federal, state, county, or municipal governments were excluded at this stage, using listed owner names in the original dataset. Land use code descriptors were also used to further refine the ownership dataset. We also excluded properties with certain listed uses, such as airports, parks, and schools, as those are unlikely to be redeveloped for additional housing or converted from their existing uses. Our full list of codes used for defining target parcels can be found in the data dictionary, and is based off of the SDAT Exemption Class code. Next, the presence of duplicate parcels and layers was handled by deleting parcels with shared IDs, and inconsistent ownership naming conventions, such as the 14 different listings of the Washington Metropolitan Area Transit Authority, WMATA, was handled through the reclassify tool of ArcGIS Arcade. Finally, the various separate layers for each county were merged to create a single layer, and public parking lots not previously identified were found and merged to this master layer.

Image 2: Comprehensive Map of Maryland Rail systems. Sourced from Maryland Department of Transportation (MTA).

The creation of the interactive map necessitated the use of ArcGIS Experience Builder, and it possesses many features designed for an intuitive user interface. The attribute table was reorganized to only include relevant fields, such as Owner Name, Address, and County. A Filter by County tool was added, which allows users to zoom into and select target counties. This tool also affects a pie chart, which is displayed alongside the layer’s attribute table and can be seen when clicking on the bottom panel of the web map. This pie chart displays the acreage within a county, or the State as a whole, organized by owner, and provides a useful summary for ownership trends across the State. The map also possesses various other layers, such as buffers, county and transit lines, and flood zones, designed to enhance user understanding and provide a more robust picture of the state of public land ownership near transit in Maryland. Lastly, the map is able to be exported and printed in a Letter ANSI A Landscape format, so it can be shared physically as well as digitally.

Preliminary Findings

The most significant finding from this project was that WMATA owns a sizable majority (65%) of public land within our transit buffer zones, indicating that the suburban counties of Washington, Montgomery and especially Prince George’s, have the greatest potential for transit-oriented development. Indeed, WMATA owns more land in Prince George’s County (754 acres) than all other public entities combined own across all counties, including Prince George’s (593 acres). This is apparent when looking at stations such as Morgan Boulevard on the blue line, Branch Avenue on the green line, and New Carrollton on the orange and future purple lines, which are surrounded by potentially developable WMATA land. 

Montgomery County, while not possessing the same extent of public land near transit as Prince George’s, still has significantly more public land near transit than any other county in the State. Almost 80% of that land (370/463 acres) is owned by WMATA. This indicates that Montgomery County should also pursue partnerships with the transportation authority to bring in new development on those stations, which can increase the availability and affordability of housing within the region. The recent announcement of new development on the North Bethesda metro station, along the Red Line, represents a positive development pursuant to this goal.

Image 3: North Bethesda Metro Station Redevelopment Concept Art. Sourced from Washington Metropolitan Area Transit Authority (WMATA).

The Baltimore region also has significant potential for transit-oriented development, with the City having approximately 14 more acres of land available than Baltimore County (100 vs 86). Both governments should seek to partner with MDOT to pursue redevelopment, as it owns over 80% of the land available for redevelopment in the combined region. Baltimore City currently has provisions in its zoning code explicitly designed for TOD, and these zones can be applied alongside other incentives to spur new activity and housing near stations in the downtown core of the city. 

Next Steps

While the work done so far represents a significant improvement in our understanding of the feasibility and availability of publicly-led transit-oriented development, more research is needed to ensure the viability of these sites. We are currently working on classifying these parcels as being partially, wholly, or not at all in a floodplain, as this characteristic is critical in determining the true viability of redevelopment projects. Likewise, we are exploring a classification of these parcels by zoning category to complement our ownership analysis. Zoning is the legal framework in which development occurs, and so parcels that are not zoned for TOD are unable to be fully utilized. We will also identify the distribution of this land by Maryland’s legislative boundaries. We will continue to revisit parcel identification and classification, as it is possible that our reliance on the SDAT PropertyView system has led to some parcels being accidentally excluded from our analysis, and others being incorrectly included.


Click here to view the interactive map.

Read More