
The Geography of Affordability: LIHTC and Submarkets
By Kathryn Howell, Executive Director of the National Center for Smart Growth and Associate Professor of Urban and Regional Studies and Planning at the University of Maryland, and Finn Meggitt, National Center for Smart Growth Graduate Assistant.
Introduction
The Low Income Housing Tax Credit (LIHTC) is the primary source of subsidy for affordable rental housing in the United States (Schwartz 2015). LIHTC uses the sale of credits – translating to reductions in tax liability – to attract capital investments in affordable properties for both new construction and preservation. In exchange, the building remains affordable for 30 years. Tax credits are federally funded, but competitively awarded by state governments based on priorities such as location, sustainability, preservation or type of developer through the Qualified Allocation Plan (QAP).
Unlike programs such as Housing Choice Vouchers or Public Housing that calculate rents based on the income of the household, LIHTC rents are generally set at 60% of the regional median income, meaning that households earning less than half of the regional income need additional forms of subsidy such as vouchers to access these buildings (Ilic 2026). Nationally, the quantity of available housing for households below 50% of area median income falls significantly short of the need. At that level of income, there are only 54 affordable homes for every 100 households who need them, while that number is 88 for households below 80% of AMI (NLIHC 2025). Locally, in Washington, DC, Maryland and Virginia, for example, there are fewer than 37 affordable and available homes for every 100 households earning less than 30% of AMI. For every 100 households earning less than half of the median income, there are 52 (Virginia) 58 (Maryland) and 64 (DC).
These gaps are exacerbated by the geography at which rents are determined. LIHTC rents are determined by median income levels at the level of the Metropolitan Statistical Area (MSA), which for the Washington DC, MSA extends from the Pennsylvania border in Frederick County, MD to Spotsylvania County in Virginia, and also includes a County in West Virginia. The constituent counties and cities of the DC MSA encompass a broad range of housing markets and income levels. Within jurisdictions, housing operates at the submarket level, and the rents that might be considered below market in Long Branch in Montgomery County would be very different than those several miles away in Chevy Chase or Bethesda (Teresa and Howell 2021). Further, they include all household incomes, rather than just renters, who have lower median income than homeowners.
Using census data and HUD income limits, this research brief examines the submarket rents of communities across the DC region to better understand: What does affordability look like for the Low Income Housing Tax Credit? Where can buildings with LIHTC rents make the strongest impact? Where are LIHTC rents above market for their locations? We find broadly that more than half of LIHTC buildings in the DC region are located in neighborhoods where LIHTC allowable rents outpace tract-level median rents, while just 25% of LIHTC buildings are located in areas where the median rents are higher than LIHTC rents.
The Geography of Affordability
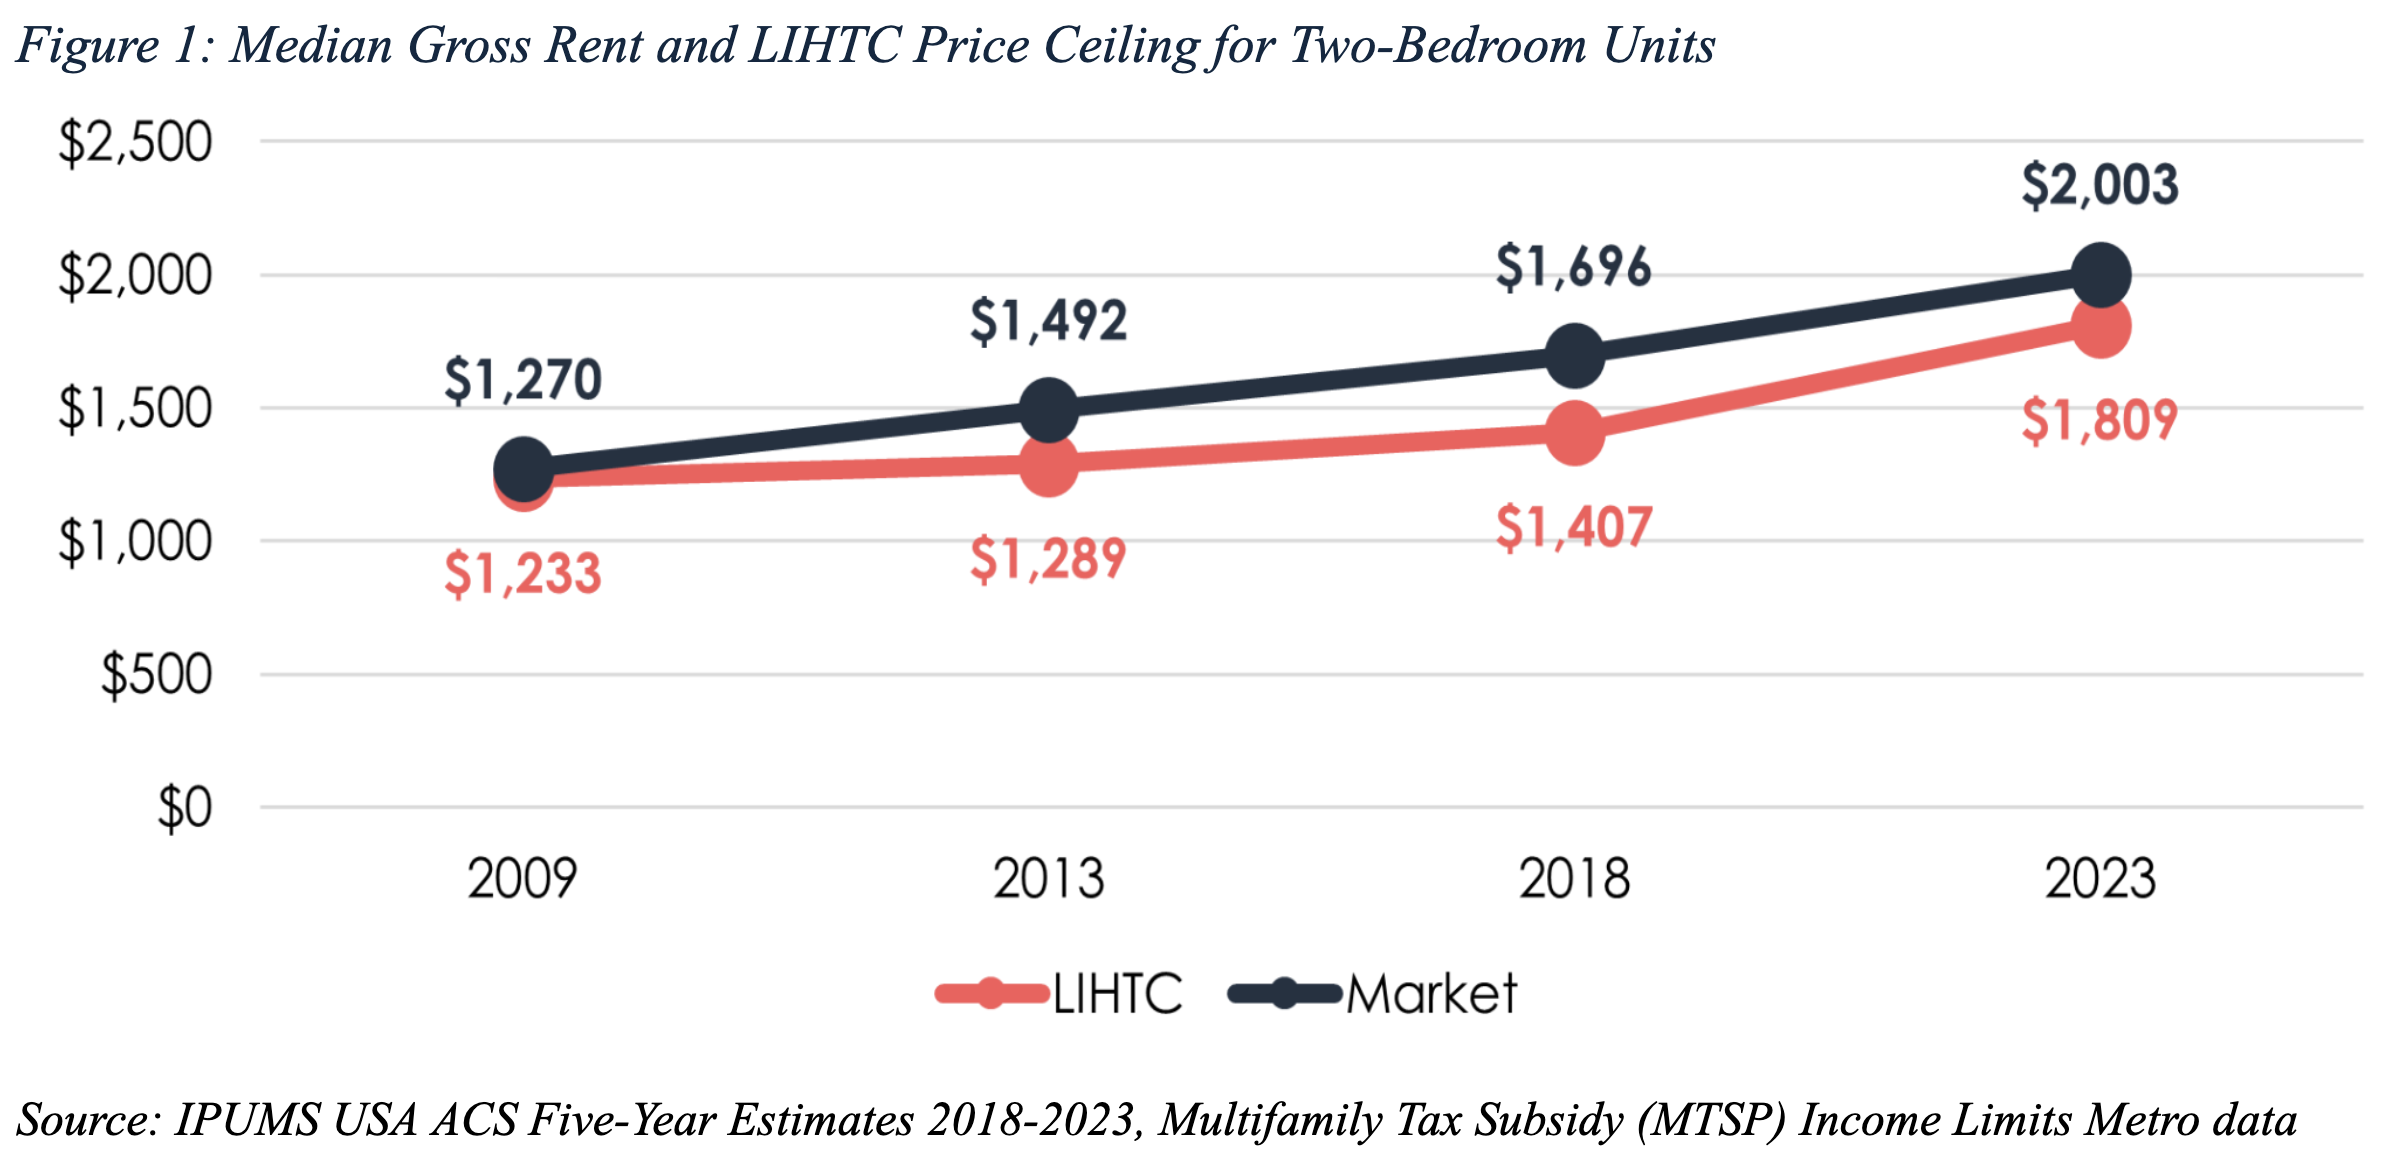
Maximum allowable rents for the Low Income Housing Tax Credit (LIHTC) are based on regional median incomes for all households and are published annually, reflecting regional changes in income. LIHTC rents are close to market rents across the region. Figure 1 shows the change in rents since 2009 for two-bedroom rentals in the region. While median market rents have increased by 58% since 2009 (unadjusted for inflation), LIHTC rents have increased by 47%. The gap between the LIHTC price ceiling and the market rate price has shifted since the aftermath of the Great Recession, with the price ceiling for LIHTC’s units being market rate in 2009, but market rate units became 15.7% more expensive in 2013, 20.5% more expensive in 2018, and shrank to only being 10.7% more expensive in 2023.
The relative affordability of Low Income Housing Tax Credit (LIHTC) rents vary across the DC Metropolitan Region. Because LIHTC rents are based on the median income across the metropolitan statistical area, the rents do not reflect either the local (e.g. County or City) income or housing market conditions. For example, figure 2 illustrates that the LIHTC price ceiling is 14.2% higher than median rents in Frederick County and 7.9% higher than in Prince George’s County. On the other hand, the LIHTC price ceiling is around 19% lower than median rents in Loudoun County and Alexandria, 35.9% lower than in Arlington, and 23.3% lower than in DC. Finally, LIHTC rents are closer to the median in Prince William County & Manassas, Montgomery County, and Fairfax County, with the LIHTC price ceiling being 5.0%, 10.6%, and 14.4% higher than in the three respective counties.
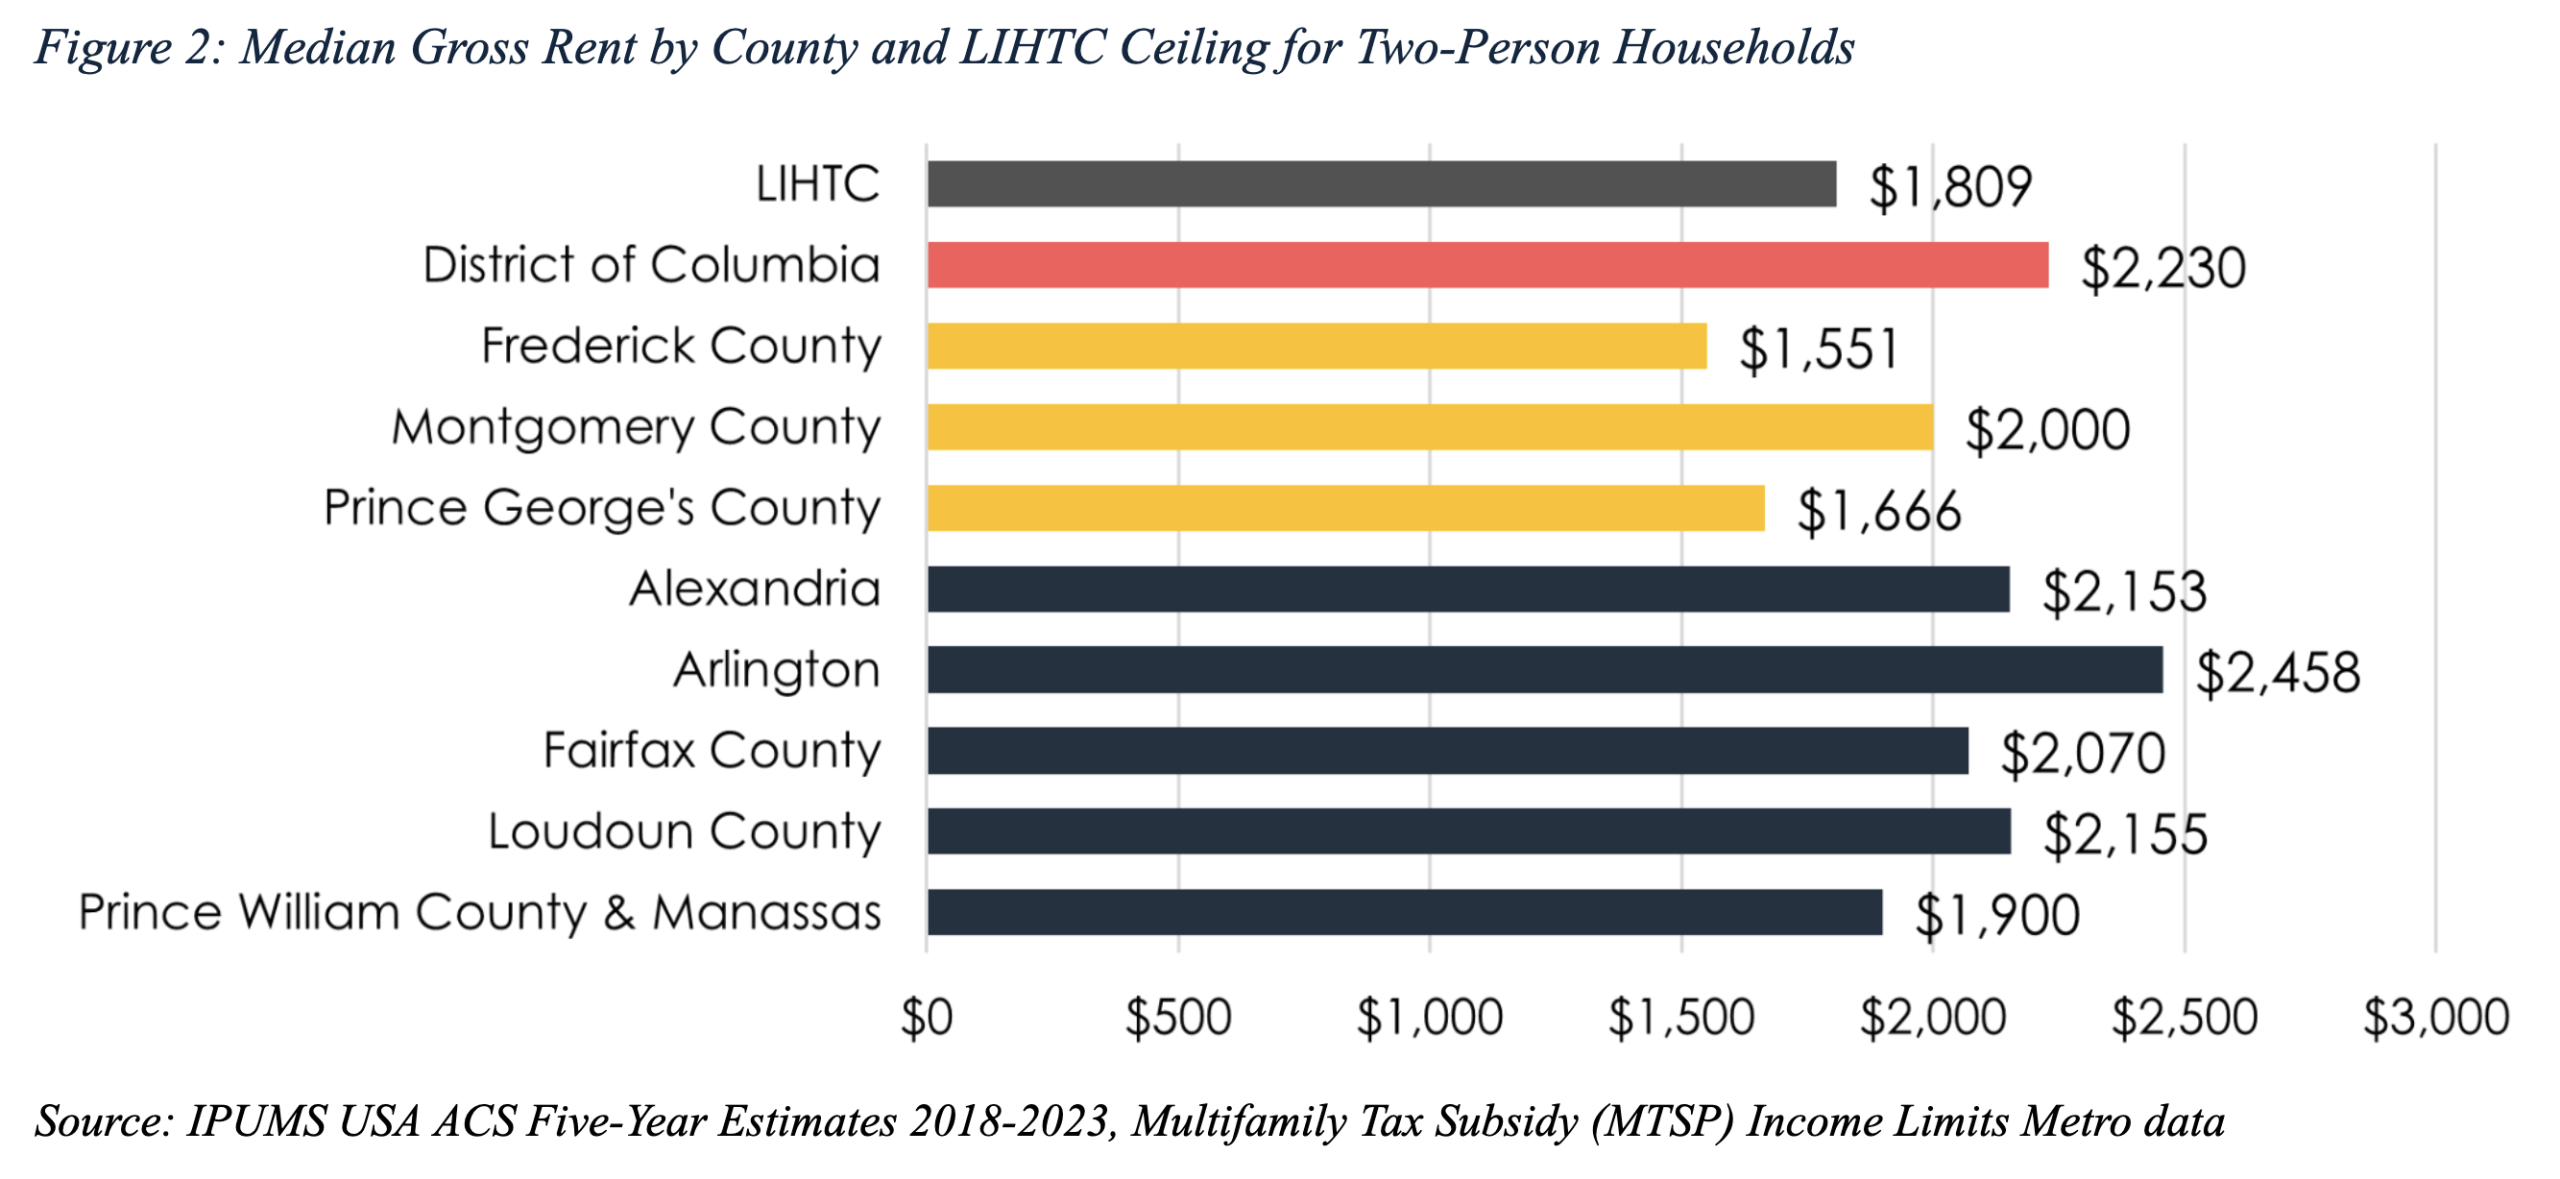
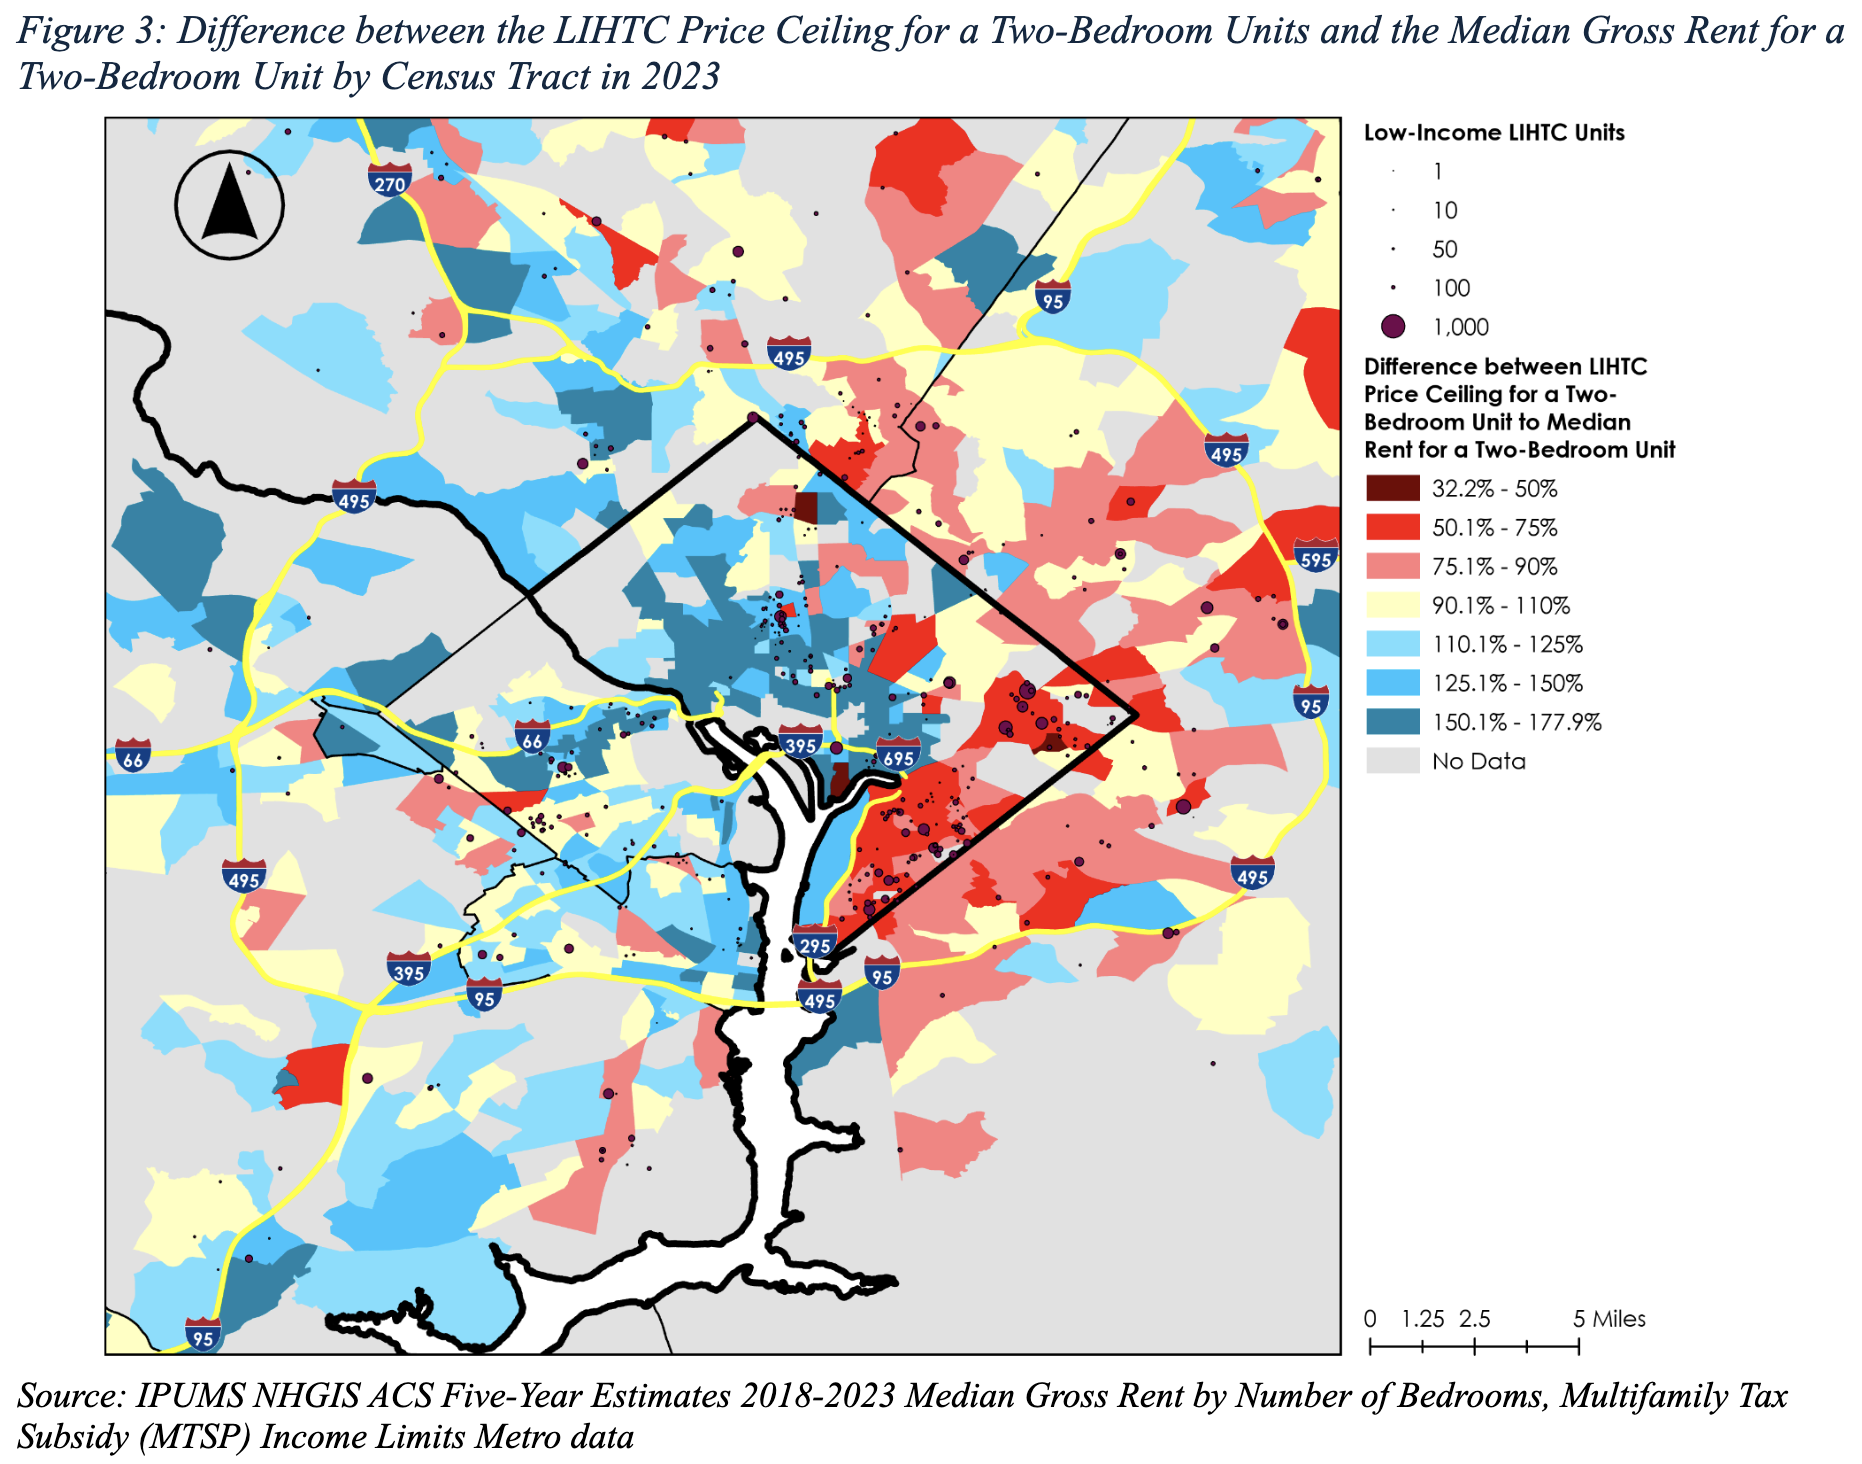
Figure 3 illustrates this issue at a more granular level. The map shows the difference between the price ceiling of a LIHTC two-bedroom unit and what the median gross rent is for a two-bedroom unit by census tract. For example, the darkest red color on the map shows census tracts where the median gross rent for a two-bedroom unit is 32.2% to 50.0% of the maximum rent for a two bedroom unit in a LIHTC property. Meanwhile the blue areas show where the LIHTC rents are below market. There are four areas with high concentrations of LIHTC units, and they are each very different markets. There is a high concentration around Columbia Heights (DC) where LIHTC units are substantially cheaper than market rate units. However, in Southeast of DC, most of Prince George’s County, the international corridor in Montgomery County, and in parts of Arlington outside the Rosslyn-Ballston Corridor, LIHTC price ceilings are at or above market rate for the tracts in which they are located.
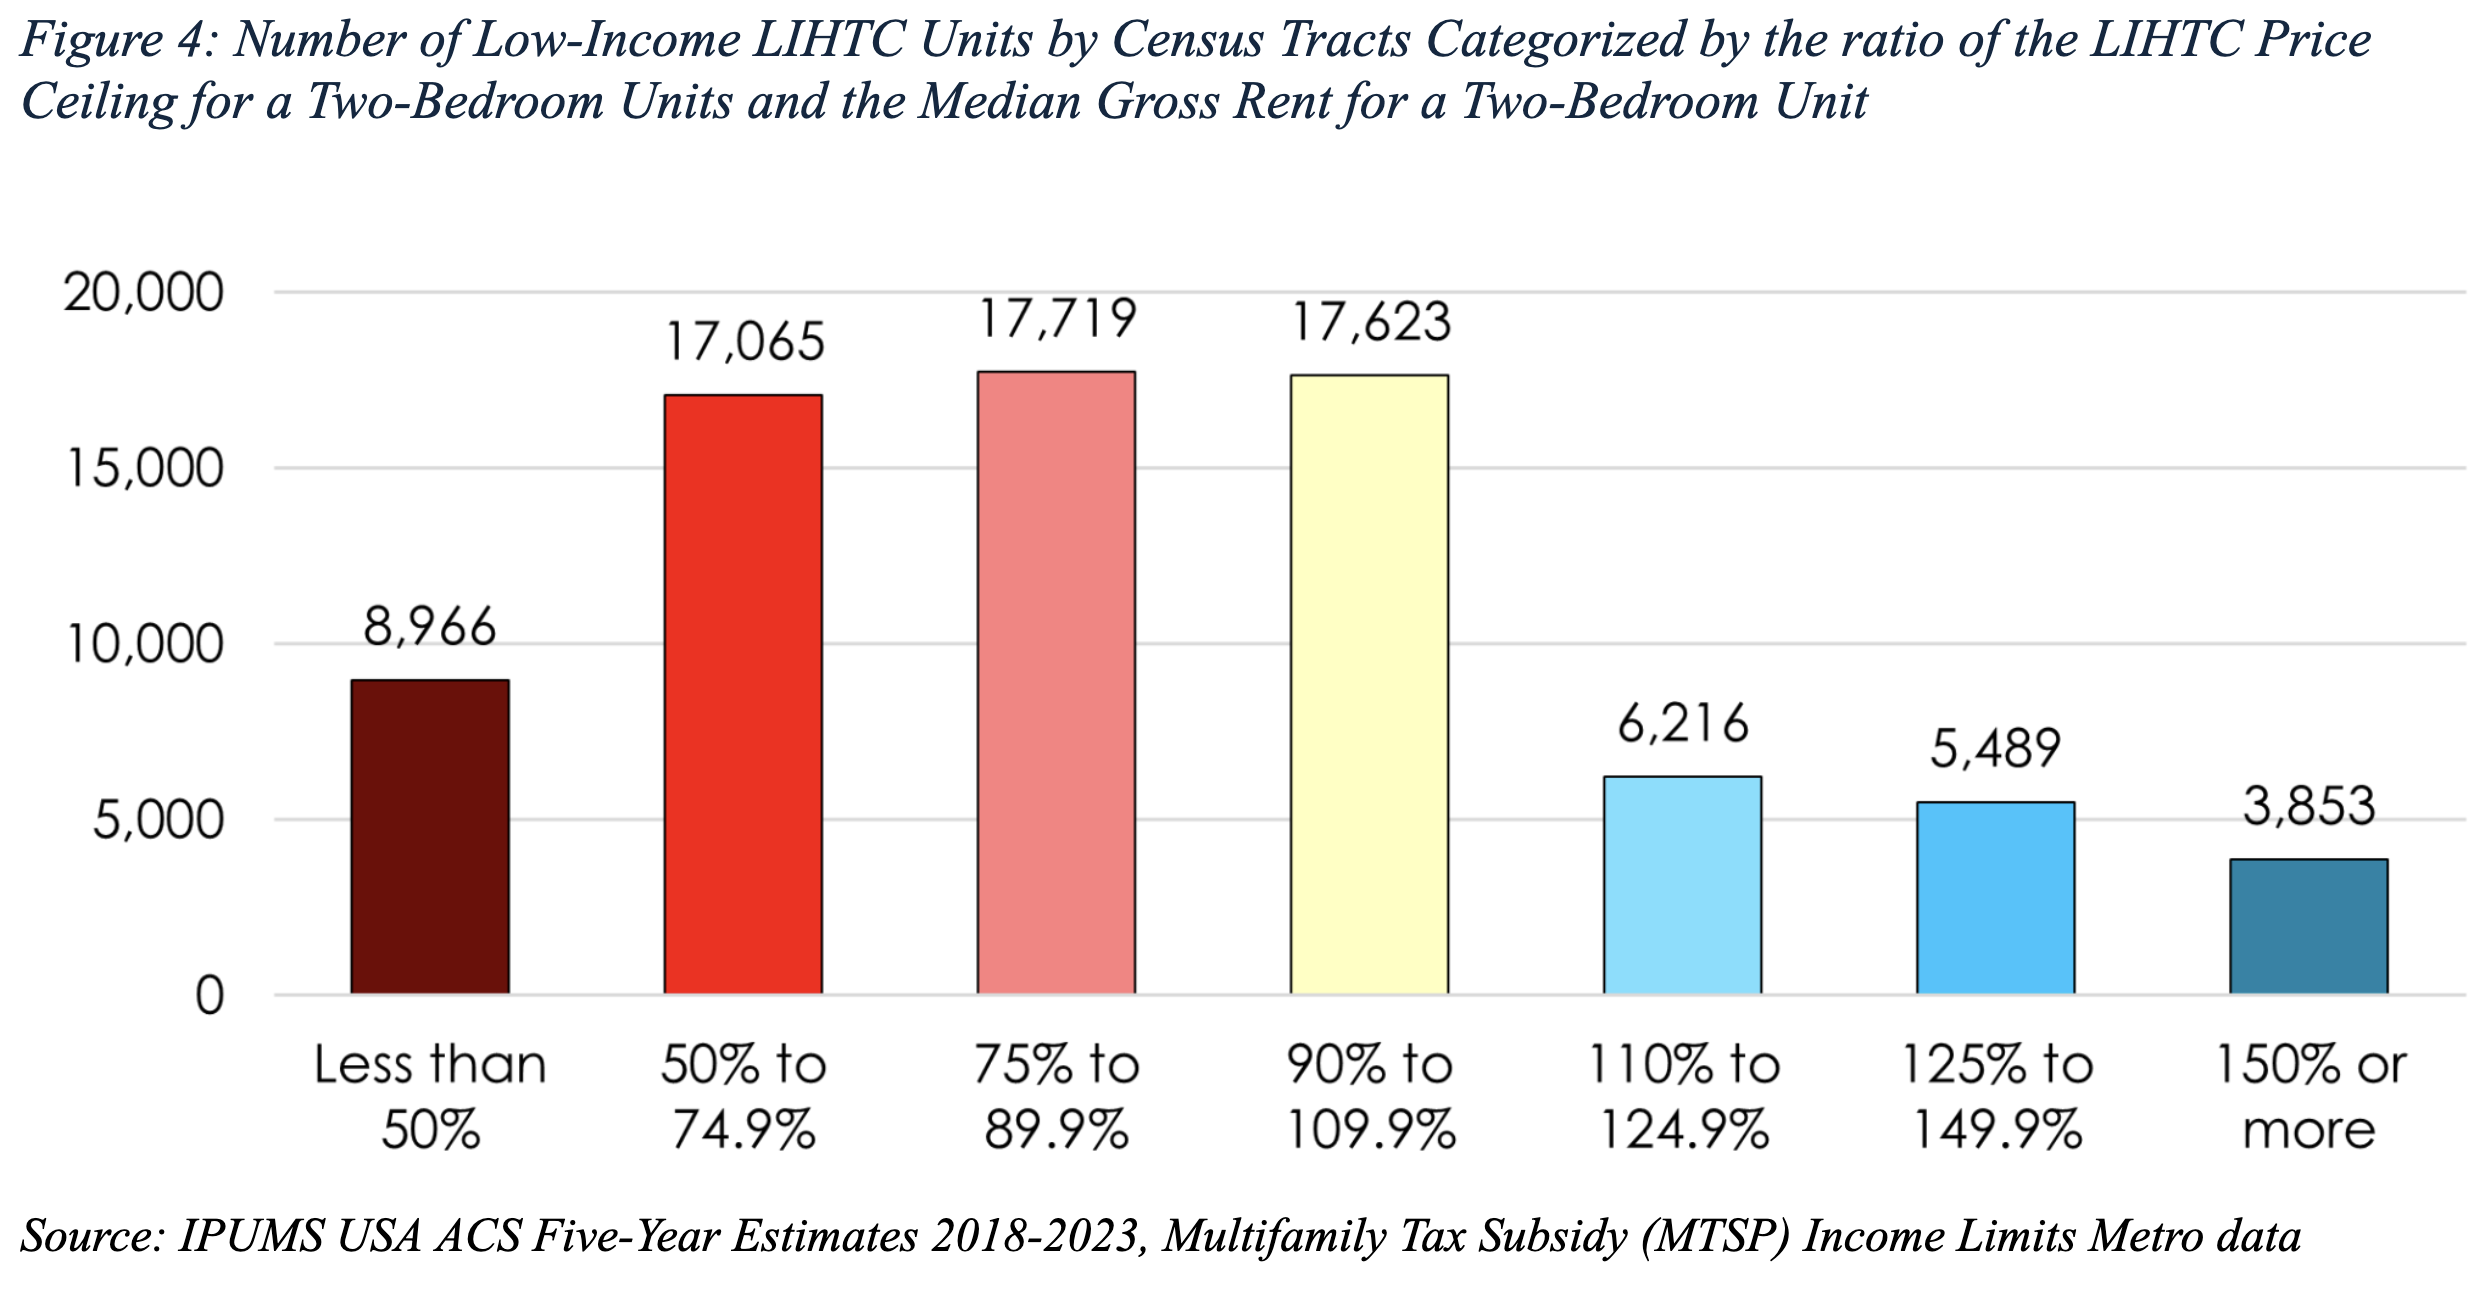
Looking deeper, we find that LIHTC buildings are actually concentrated in neighborhoods where the allowable rents are higher than the local market rents. Figure 4 shows the number of LIHTC units in the region by the percentage difference between tract level median rents and LIHTC rents for a two bedroom apartment. More than half (55%) of LIHTC units in the region are located in tracts where median rents are lower than LIHTC allowable rents, while only 5.6% are located in areas where the tract rents are more than 150% of LIHTC rents.
Implications
This research has critical implications for the long-term stability and utility of LIHTC buildings, the ways we allocate affordable housing funds, and the tools we use to fund affordable housing. From a real estate perspective, LIHTC buildings located in below market communities cannot rely on rent increases that may be possible in areas where market rents are increasing. In other words, in a weak market context, building owners could potentially have to offer rents that do not match their expenses to avoid high vacancies. Because building owners are typically paying mortgages based on assumptions of particular rents, downturns can destabilize LIHTC buildings in this context.
From a policy perspective, this poses critical questions about where we prioritize the construction of LIHTC buildings. LIHTC buildings may have the greatest impact in areas where their rents offer access to homes in high-cost communities for renters who have incomes below the median. However, these areas also pose challenges for acquisition, zoning and construction due to elevated per unit costs and exclusionary land use practices. Moreover, public resistance to affordable housing in high-income and predominantly white communities can cause significant delays, which can make the project no longer viable or prevent it entirely. At the same time, subsidized housing in already affordable communities can offer quality housing alternatives for households who wish to remain in their neighborhoods to retain community ties.
This challenge elevates the need to think about how and for whom we subsidize affordable housing – and what additional tools we need to make housing affordable at the state, local and federal levels. Recently, local legislatures and advocates in places like Washington, DC have proposed requiring the use of sub-regional or local incomes to set rents, the issue could also be addressed by changing the income targeting, which could be done by requiring or incentivizing the targeting of lower incomes using the Qualified Allocation Plan (QAP). At the same time, requiring lower rents may require additional subsidy to meet the underwriting needs of the project. While many developers layer subsidies such as Place-Based Section 8 vouchers and tenants do the same with tenant-based vouchers to make the building accessible to lower income households, we face an acute shortage of subsidized housing funds across the board, with more than 75% of households who qualify for it unable to access it, and this shortage hits households earning less than half of the regional median income – who are disproportionately people of color – the hardest. In other words, without additional sources of local, state and federal funding for housing, we will face an ongoing trade off between the volume of housing we build and the affordability at which we build it.
References
IPUMS USA (2023). Microdata [Data set]. United States Census Bureau. https://usa.ipums.org/usa/
National Historic Geographic Information Systems. (2025). County-Level Census Data [Data set]. US Census Bureau. https://www.nhgis.org/
Schwartz, Alex F. 2015. Housing Policy in the United States. Routledge.
United States Department of Housing and Urban Development Office of Policy and Research. (2025). Multifamily Tax Subsidy (MTSP) Income Limits [Data set]. United States Department of Housing and Urban Development Office of Policy and Research.. http://huduser.gov/portal/datasets/mtsp.html


