News

2025 Maryland Commuter Survey

Written by Alex McRoberts and Chester Harvey, Transportation Policy Research Group

Introduction

The Maryland Commuter Survey provides an annual snapshot of how Maryland residents travel to work and how broader transportation, work, and lifestyle factors shape commuting behavior across the state. Conducted by the National Center for Smart Growth (NCSG) in partnership with the Maryland Department of Transportation (MDOT), the survey helps track transportation system performance and inform planning and policy decisions.

The 2025 survey was collected in May and June from 943 adult workers living in Maryland. Now in its fourth consecutive year, the survey allows us to compare commuting patterns between 2022 and 2025, a period shaped by the long-term effects of the COVID-19 pandemic, changing work arrangements, and evolving transportation needs.

The 2025 results suggest that Maryland’s commute patterns have become more consistent in recent years. Statewide averages point to a post-pandemic pattern that has changed less sharply in recent years, though workers’ experiences continue to differ by geography, commute mode, work arrangement, and access to reliable transportation.

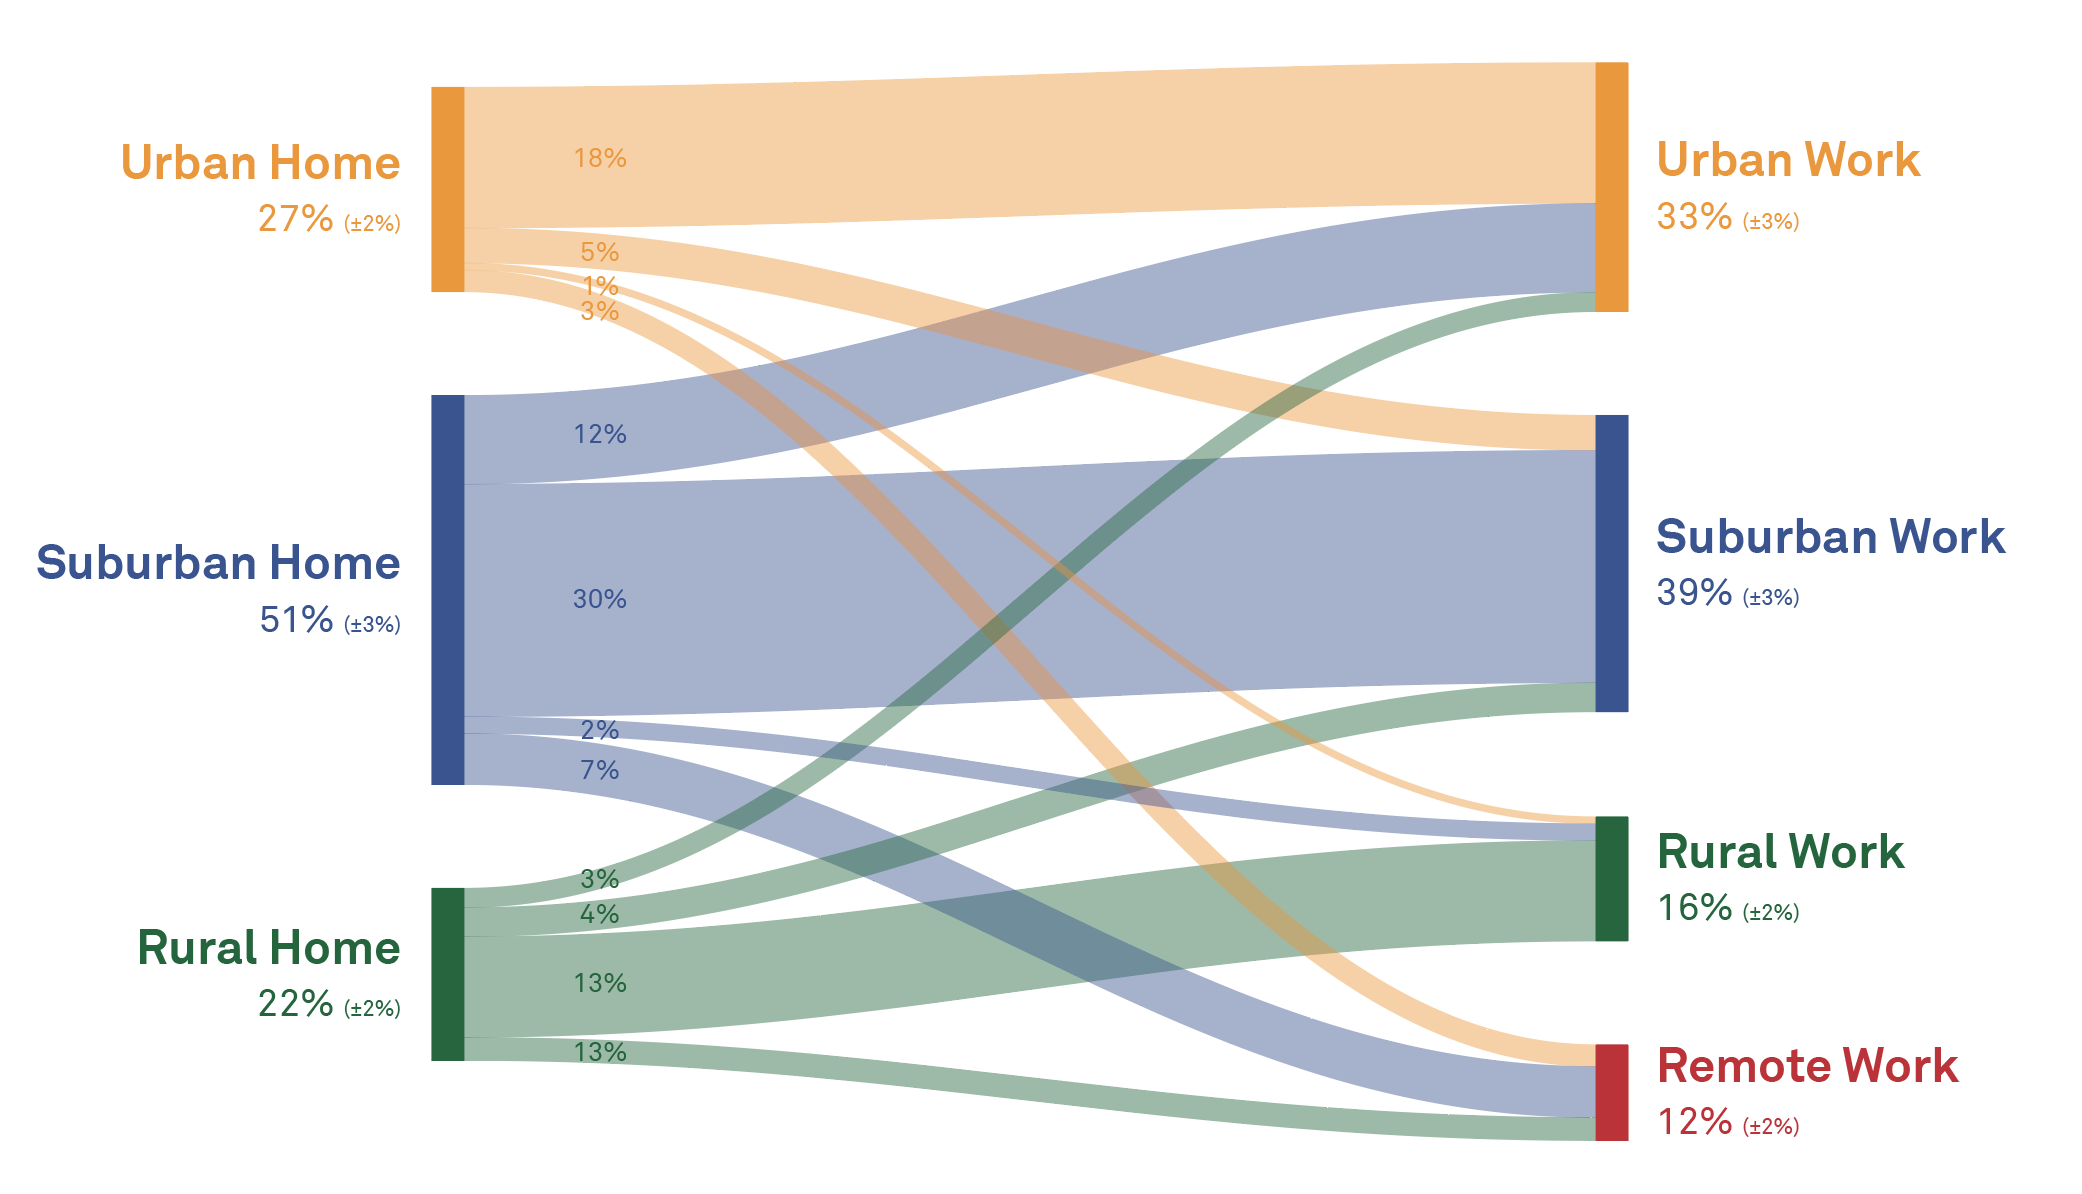
Figure 1. Shares of workers commuting from urban, suburban, and rural home locations to urban, suburban, rural, or remote work locations. Hybrid workers are included in the geographic work locations where they physically commute, while fully remote workers are shown as remote.

How The Survey Was Conducted

The 2025 Maryland Commuter Survey was administered online by Qualtrics Research Services to 943 adult workers living in Maryland. The survey was designed to represent Maryland’s resident workforce overall, rather than provide precise estimates for workers in each county individually.

To improve representativeness, we used quota sampling during data collection and applied statistical weights after the survey was completed. Quotas were based on key demographic characteristics, including gender, age, race and ethnicity, and whether respondents lived in urban or rural counties. Final results were also weighted by age, race and ethnicity, and urban-rural residence so statewide findings better reflected Maryland’s adult worker population.

Respondents answered questions about employment, workplace location, commute behavior, transportation resources, preferences, and perceptions. The survey also included a retrospective travel diary, asking workers which days they worked during the previous calendar week and how they traveled to work on those days. Approximate home and work locations were collected through an interactive map interface, and survey responses were supplemented with estimated commute distances and travel times.

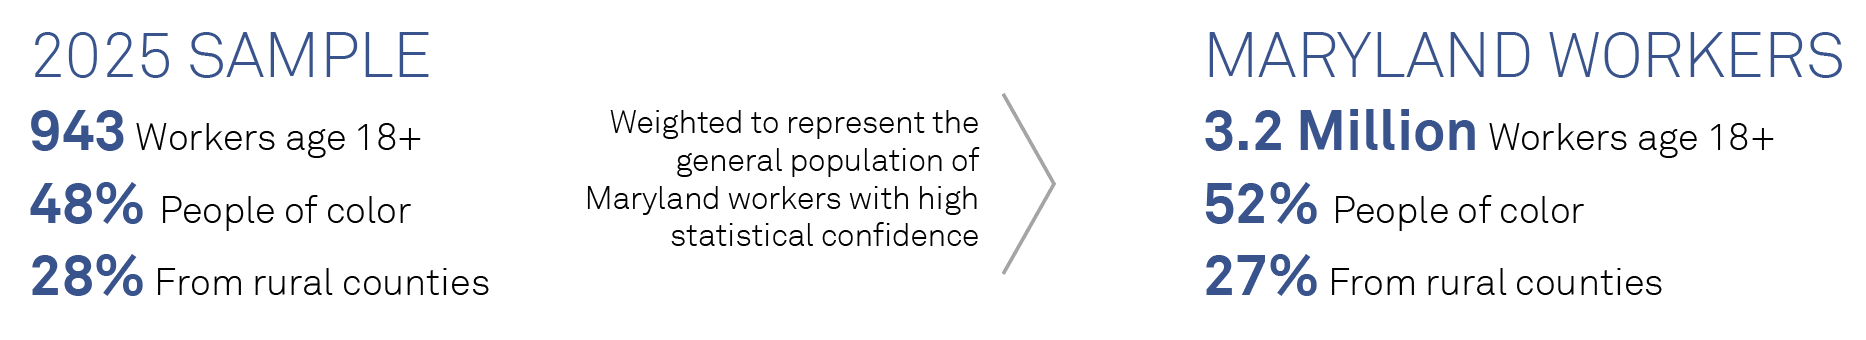
Figure 2. Weighting Diagram

What We Found

Commute mode shares have remained relatively stable.

In 2025, automobiles remained the dominant commute mode in Maryland, accounting for 71% of commute trips. Transit accounted for 10% of trips, active transportation accounted for 3%, and telecommuting accounted for 16% of potential commute trips that might otherwise have involved physical travel.

Mode shares fluctuated somewhat between 2023 and 2025, but the changes did not point to a clear trend toward increasing or decreasing use of any particular mode. These patterns suggest that Maryland commuting may have reached a relatively stable post-pandemic pattern by 2023, rather than continuing to shift sharply year to year.

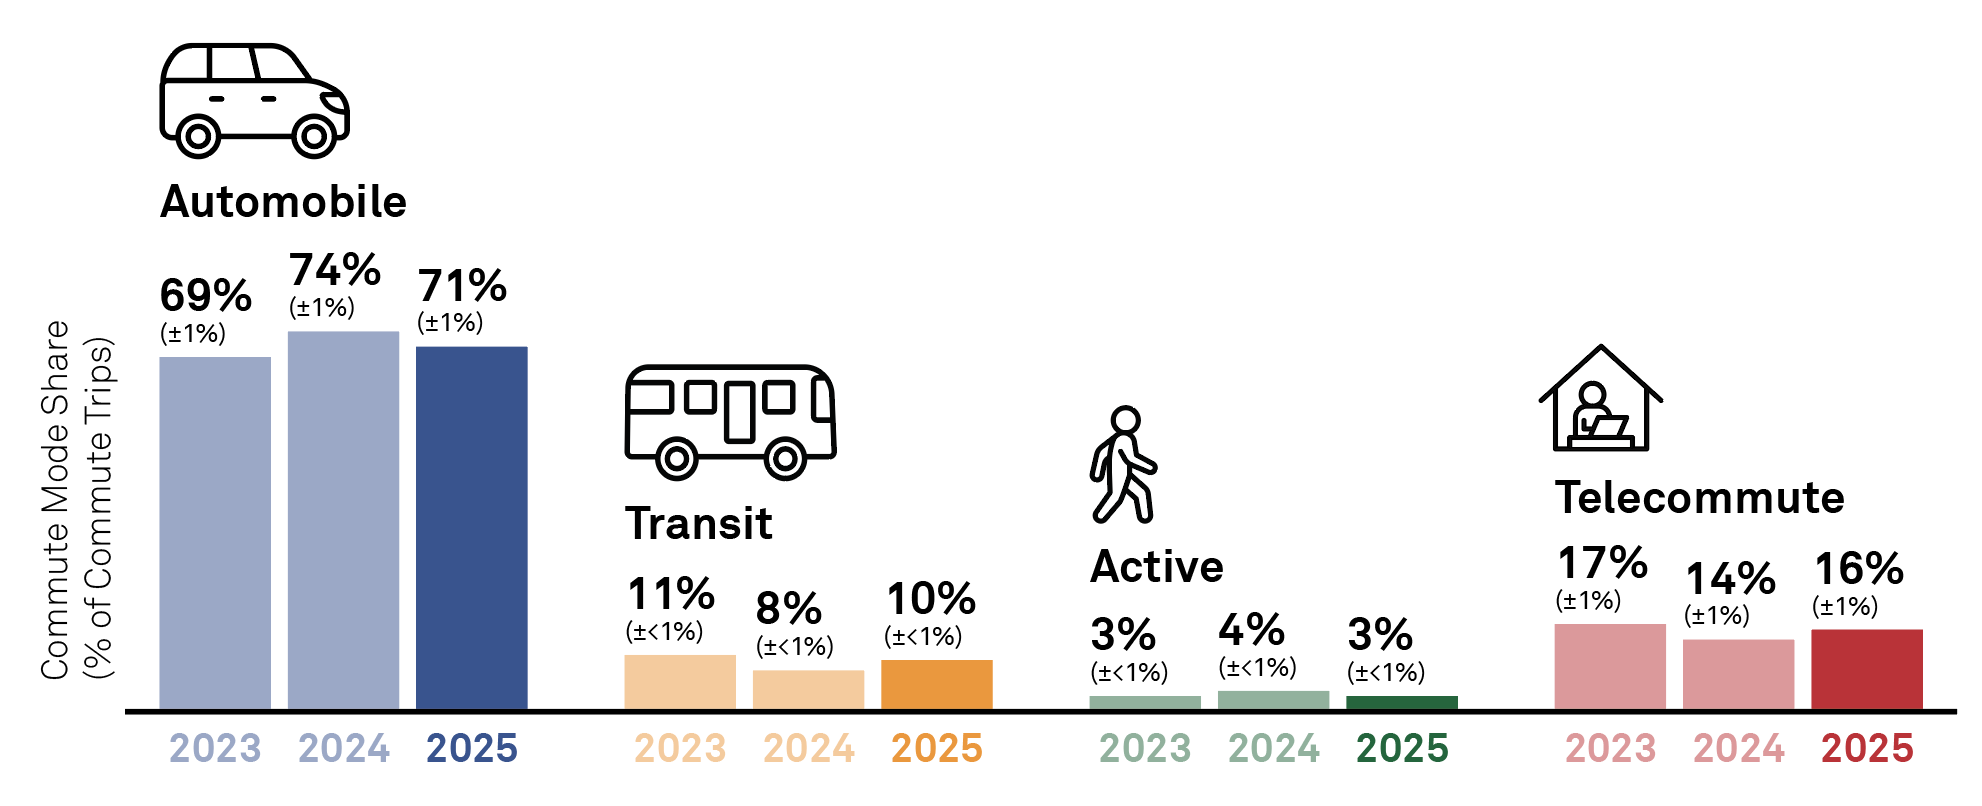
Figure 3. Shares of commute trips by automobile, transit, active, and telecommute in 2023, 2024, and 2025. Margins of error are calculated with 90% confidence.

Commute timing remained concentrated in peak periods.

Despite changes in work location and commute frequency, commute timing remains strongly shaped by traditional peak periods. Approximately two-thirds of physical commute trips began during morning or afternoon peak hours, while about one-third occurred outside peak periods. Fifteen percent of trips began overnight, and 10% began during the middle of the day.

Between 2023 and 2025, the share of reported commute trips beginning in the afternoon increased by 15%, suggesting that afternoon peak-period travel may be becoming somewhat more concentrated than it was earlier in the post-pandemic period. Peak-period travel therefore remains important for transportation planning, even as hybrid work and nontraditional schedules persist.

Figure 4. Shares of physical (non-telework) commute trips in each survey year that began in early morning (12:00 am–5:59 am), morning (6:00 am–9:59 am), midday (10:00 am–1:59 pm), afternoon (2:00 pm–5:59 pm), evening (6:00 pm–8:59 pm), and late night (9:00 pm–11:59 pm) hours. Line colors indicate years. Trips both to work and from work are included. Margins of error are calculated with 90% confidence.

Many workers do not commute to the same place every day.

The survey also shows that commuting cannot always be understood as a daily trip from home to a fixed workplace. In 2025, workers’ home and work locations were distributed across urban, suburban, and rural settings. However, only 52% of workers reported commuting to a consistent location every day they worked. The remaining 48% followed more variable patterns. Some changed job sites, some commuted before traveling elsewhere for work, and others traveled directly from home to different work locations.

This matters because many transportation planning tools and programs are still organized around a relatively consistent home-to-work commute, even though work-related travel is more variable for many Maryland workers.

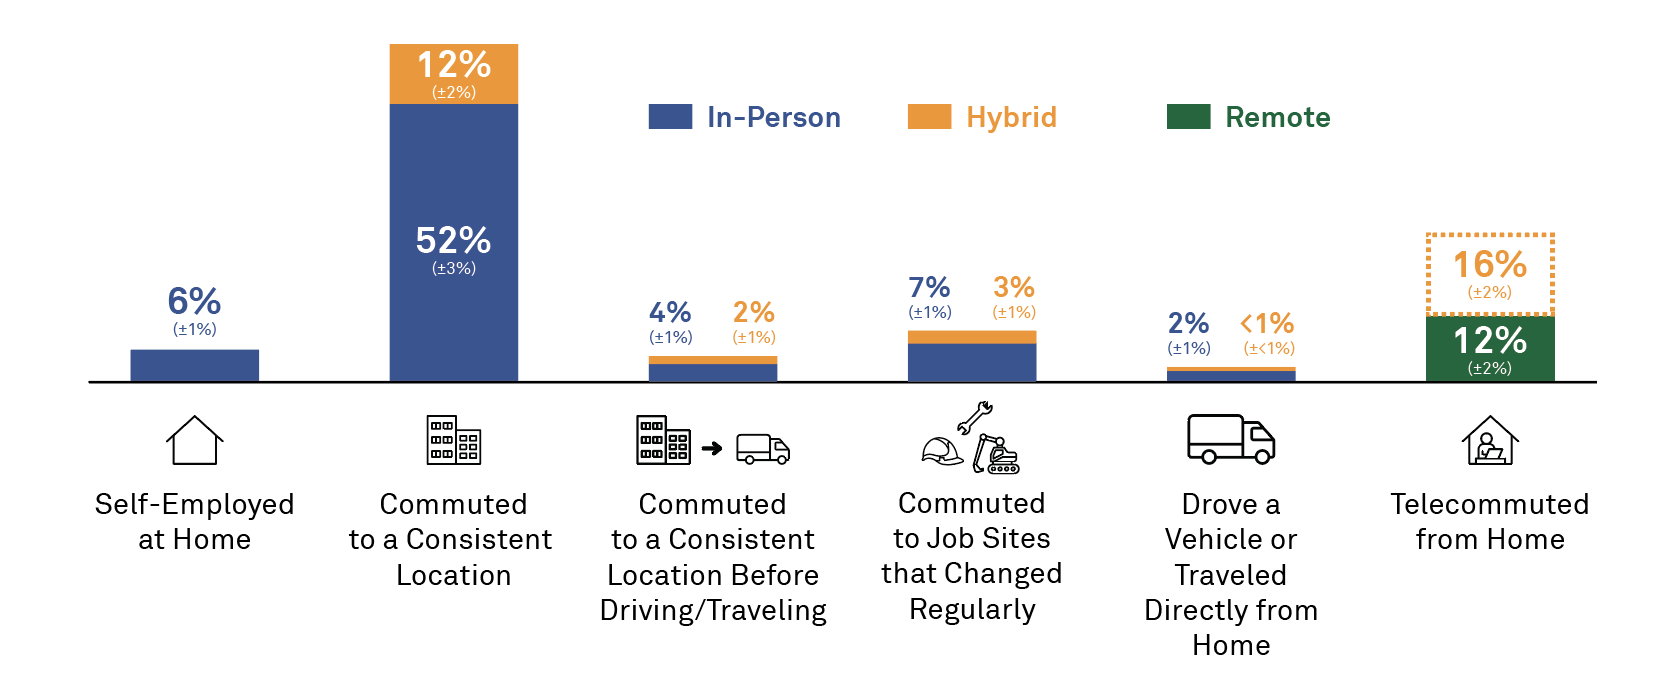
Figure 5. Share of workers by work and commute pattern.

Average commute time remains steady, but varies by commute mode.

The average one-way commute time in 2025 was 29 minutes, statistically unchanged from recent years. Straight-line commute distance averaged 12 miles, also remaining stable within margins of error.

Commute times varied by mode and geography. Transit commuters averaged 33 minutes, compared with 25 minutes for automobile commuters and 13 minutes for active commuters. Metropolitan regions tended to have longer travel times despite shorter commute distances, while more rural regions had longer distances but higher average speeds.

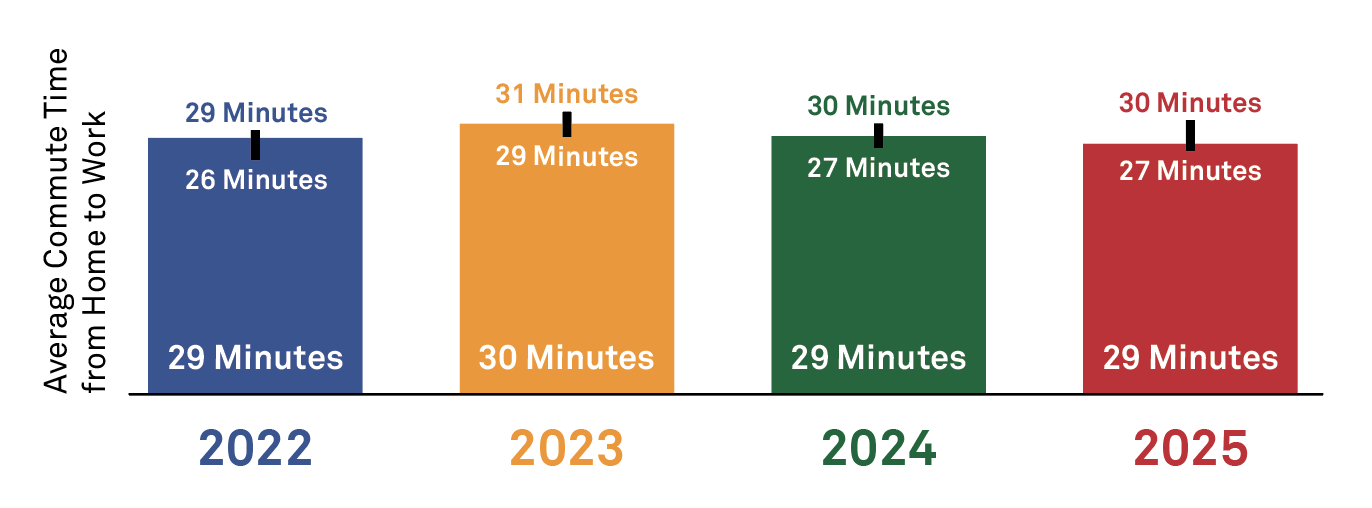
Figure 6. Average commute times from home to work by year. Workers who were fully remote and self-employed at home were excluded. Labeled ranges and error bars show 90% confidence intervals.

Satisfaction is high, but transportation challenges remain.

Overall satisfaction with Maryland transportation services remained high. In 2025, 83% of workers reported being satisfied with MDOT services, including 32% who were very satisfied and 51% who were somewhat satisfied. 

Sixty-two percent of workers agreed that public transit could take them where they wanted to go, and 65% agreed that they were satisfied with the transportation options available to them. However, about one in five workers disagreed with these statements. This suggests that while satisfaction is generally strong, not all workers feel well served by the transportation options available to them.

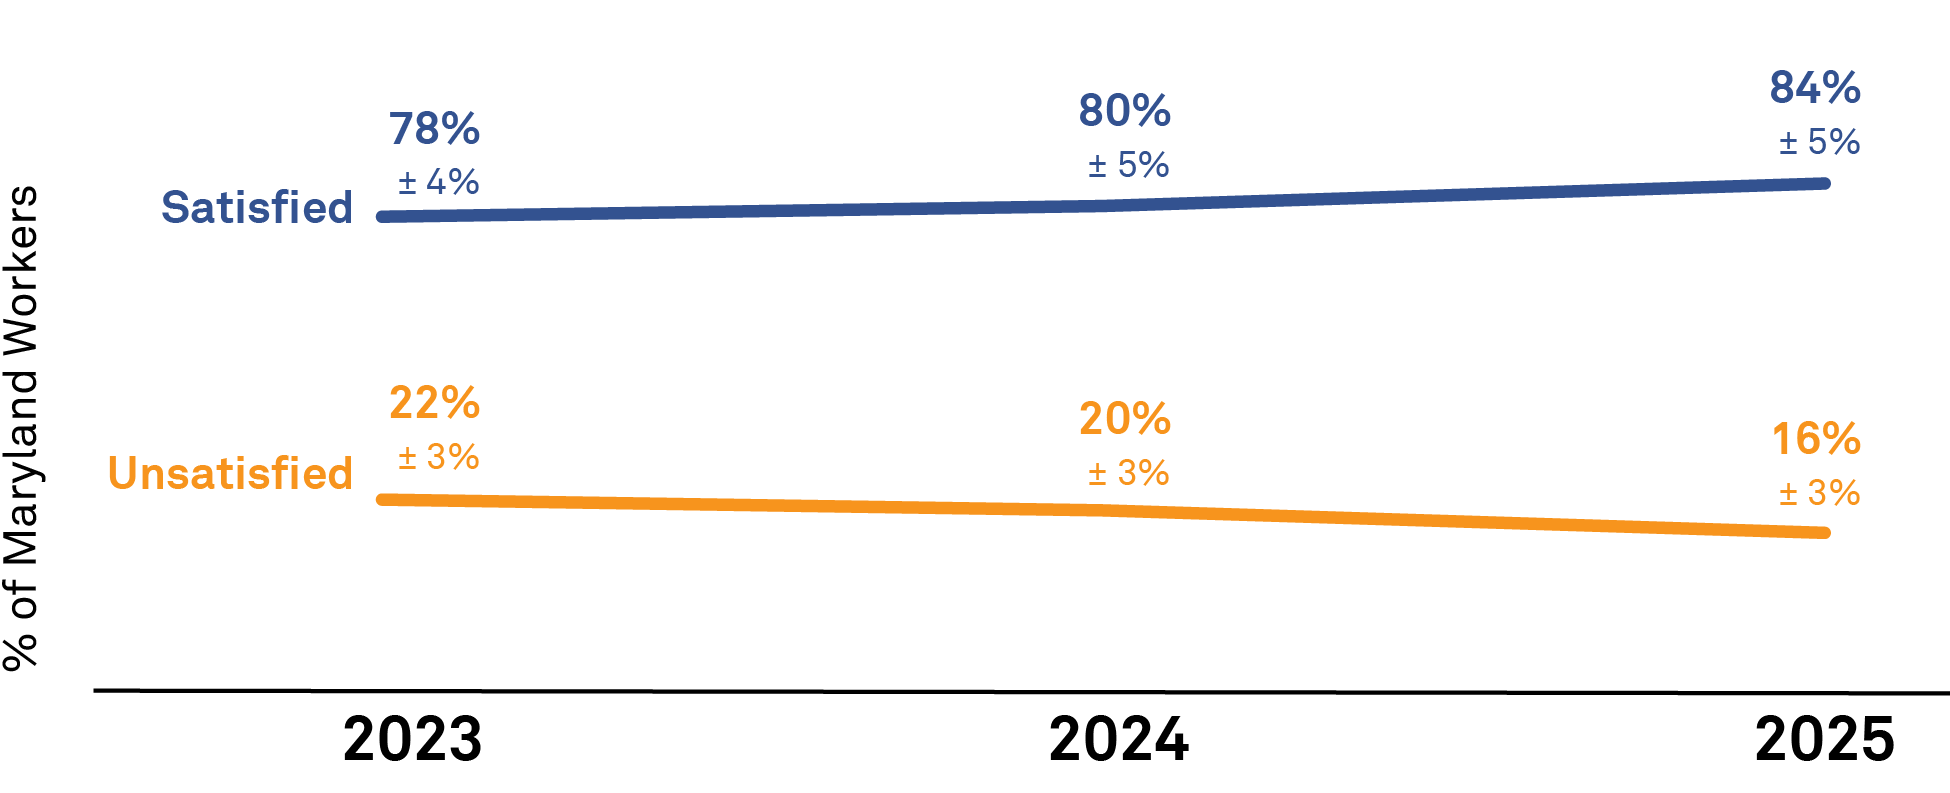
Figure 7. Shares of Maryland resident workers who reported being satisfied, including very satisfied and somewhat satisfied, or unsatisfied, including very unsatisfied and somewhat unsatisfied, with transportation services provided by MDOT over three MCS years.

Transportation insecurity remains unevenly distributed.

Most Maryland workers did not report recent transportation disruptions, but 34% experienced at least some transportation-related lateness in the past 30 days, and 10% reported being late often. Transportation insecurity, measured using the Transportation Security Index, varied modestly by geography but more sharply by race, disability status, and commute mode.

Forty percent of workers identifying as people of color were transportation insecure, compared with 30% of white workers. Forty-five percent of workers with disabilities were transportation insecure, compared with 33% of workers without disabilities.

Differences were especially visible by commute mode. Fifty-nine percent of transit commuters and 49% of carpoolers were classified as transportation insecure, compared with 31% of solo drivers and 29% of exclusive teleworkers. These findings suggest that reliability-related transportation challenges are unevenly distributed and may not be fully captured by general satisfaction measures.

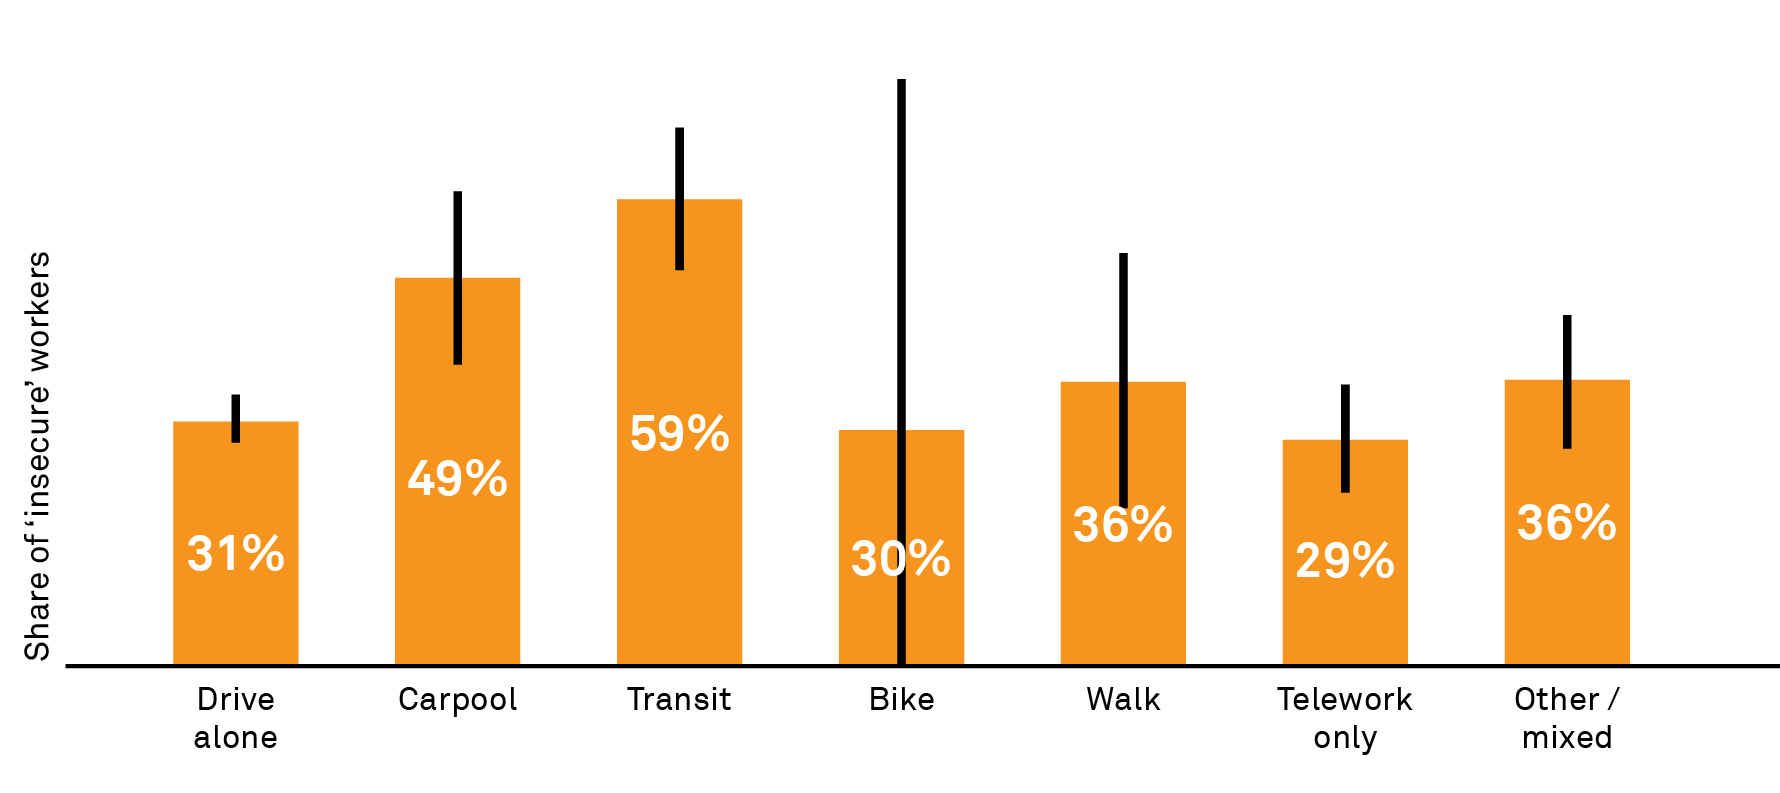
Figure 8. Shares of transportation insecure workers by primary transportation mode used for commuting. Error bars show 90% confidence intervals. The large confidence interval for bike commuters reflects the small sample of workers who commuted by this mode.

Tracking Maryland’s Changing Commute

The 2025 Maryland Commuter Survey points to a statewide commute pattern that has become more consistent in recent years, while remaining highly varied across workers and regions. Telecommuting continues to displace some physical commute trips, many workers do not travel to a fixed workplace every day, and commute mode, timing, distance, and reliability continue to differ across Maryland’s workforce.

Looking ahead, the 2026 Maryland Commuter Survey will build on these findings by asking more directly about commute preferences, awareness of transportation options, and factors that might encourage workers to consider different ways of getting to work. As the survey enters its fifth year, it will continue to help MDOT and NCSG track changing commute patterns and identify where transportation improvements can support workers across the state.


  1. https://transportation-insecurity.umich.edu/
Read More

Factory-Built Housing in Maryland

Written by Rebecca Garman, Doctoral Student and National Center for Smart Growth Graduate Assistant

Read the report here.

Introduction

Manufactured and modular housing – also called “factory-built housing” – offer a promising strategy to address the housing affordability crisis. Industrialized production offers time savings, favorable economies of scale, and gains in quality and energy efficiency, and the resultant cost efficiencies can translate to greater affordability for residents [1, 2, 3]. Given Maryland’s significant housing shortfall to accommodate projected growth, accelerating the production and development of factory-built housing can help address this gap.

However, these benefits can be offset by regulatory barriers and entrenched attitudes that deter the manufacture, construction, and placement of factory-built housing in communities. The State of Maryland passed the Housing Expansion and Affordability Act (HB 538) in 2024, which prohibits county and city governments from denying the placement and construction of a new manufactured home or modular dwelling in single family residential zones. [5] The Act presents an opportunity to produce more housing units by streamlining localized land use controls around the placement of factory-built housing, which currently cause delays and confusion in the development process. 

However, there are lingering issues that present challenges to unlocking greater uses of factory housing in Maryland. Utilizing public data and qualitative interviews with representatives from industry groups, manufacturers, and developers, this study explores how barriers emerge throughout the lifecycle of factory-built housing – from manufacturing and design, through transportation, development, and permitting – that can make it challenging to produce these housing units at scale. Given that one of the most significant obstacles in producing more factory-built housing in Maryland is local land use and zoning, the report also includes policy audit analysis of the county ordinances and zoning codes in seven counties in the state. The paper concludes with a discussion of notable practices and lessons learned from other states.

Regulatory Landscape for Factory-Built Housing

While both manufactured and modular homes may be produced in-part or fully in a factory setting and transported to a site for installation, they are defined and regulated by different levels of government. The National Manufactured Housing Construction and Safety Standards Act of 1974 defined manufactured housing and provided a nationwide building code for these homes, whereas modular homes are defined and regulated by the State of Maryland and are subject to state and local building codes. [1] There is no national modular building code, and an estimated 38 states, including Maryland, have state-specific modular building standards and programs. [6, 7]

Chart with definitions and regs, factory and building conditions, and building codes for manufactured housing versus Modular Housing.

Figure 1: Distinctions between manufactured and modular housing.

Manufacturing and Developing Factory-Built Homes in Maryland

Maryland is served by a regional network of factory-built manufacturers. Maryland does not have any manufacturing plants, but nearby Pennsylvania and Virginia have 12 and 1 plants, respectively, as of mid-2024. [8] There is a limited supply of modular manufacturing facilities in that provide full-service modular home construction in Maryland. Nearby states have a variety of modular housing facilities, as well as prefabricated parts producers and/or trade-related services. This clustering can partly be attributed to lower land costs in nearby states, as well as real and perceived market demand.

"It becomes a chicken and egg situation. It's tough to have a commitment of units if you don't have a facility [in place], and it's tough to get financing in place for a facility and be credible if you don't have a pipeline of unit commitments." (Industry interviewee, 2025)

Transportation and shipping are important dimensions of this regionalized manufacturing ecosystem. More localized transport results in downstream savings for the developer, which factors into the final sale price. Sufficient demand is also essential to meet the required economies of scale to ensure the manufacturing facility is appropriately staffed and productive. However, Maryland has seen little uptake of factory-built housing, compared to other states. Over the last ten years, manufactured housing shipments have remained relatively static. Maryland has tended to have some of the lowest numbers of shipments within the region, except for the District of Columbia.

Line graph that includes data for Maryland, Pennsylvania, Virginia, DC, Delaware, and West Virginia

Figure 2: Annual Shipments of Manufactured Housing Units to Maryland and Nearby States, 2014-2024. Credit: NCSG analysis of the US Census Bureau’s Annual Manufactured Housing Survey.

Given these dynamics, as well as the long-term opportunities to increase jobs and material outputs, Maryland should foster an ecosystem of producers and servicers of industrialized construction. In the meantime, Maryland can and should take a regional perspective by planning for greater production opportunities; encouraging a greater local uptake of factory-built housing; and collaborating with the growing network of organizations, academic institutions, and industry partners in supporting the incubation of industrialized construction facilities, services, and jobs.

The development of factory-built housing in Maryland is driven by market dynamics and influenced by state and local policy frameworks. From a market perspective, high land costs create major barriers to developing more factory-built housing at scale. Further, in many jurisdictions, zoning regulations may outright ban manufactured housing, whether in manufactured housing communities or on privately owned lots, which adds complications and expenses to projects to rezone or seek exceptions or variances. [2] Counties across the state have wildly different definitions and approaches for modular housing. Some have defined rules around modular homes, whereas others don’t address it. 

These inconsistencies also highlight a clear need for capacity building and ongoing training and support for Maryland counties around factory-built housing. There is a tremendous opportunity for the state of Maryland to support local governments in updating their codes to be in alignment with HEAA. State leadership will be key in supporting counties’ move from planning and policy to implementation and build capacity and knowledge to ease barriers.

References

  1. Dawkins, C. J. (2025). Local land use regulations and new mobile home concentration. Urban Studies. https://doi.org/10.1177/00420980251335564 
  2. Kaul, K. & Pang, D. (2022). The Role of Manufactured Housing in Increasing the Supply of Affordable Housing. The Urban Institute Accessed at https://www.urban.org/research/publication/role-manufactured-housing-increasing-supply-affordable-housing  
  3. Rumbach, A., Sullivan, E., Curran-Groome, W., Rosenow, A., & Cohen O. (2025). Building a Climate-Resilient Manufactured Housing Stock. The Urban Institute. Accessed at https://www.urban.org/research/publication/building-climate-resilient-manufactured-housing-stock 
  4. Maryland Department of Housing and Community Development. (2025). Turning the Key: Unlocking Maryland’s Potential. Accessed at https://dhcd.maryland.gov/TurningTheKey/Documents/HB538-FAQ.pdf Maryland 
  5. National Center for Smart Growth. (2025). 2025 State Housing Need Assessment Released. Accessed at https://www.umdsmartgrowth.org/news/2025-shna/ 
  6. Modular Building Institute. (n.d.). Breaking Down the “Modular Building Code.” Accessed at https://www.modular.org/2020/02/03/breaking-down-the-modular-building-code/ 
  7. ICC NTA. (2025). Ten Things to Know About Building with Modular/Off-Site Products. Accessed at https://www.icc-nta.org/ten-things-to-know-about-building-with-modular-off-site-products/#:~:text=State%20modular%20programs%20exist%20in,to%20construction%20of%20any%20type
  8. Maryland Department of Labor. (n.d.). Manufactured (Mobile) Homes and Modular Homes- Building Code Administration. Accessed at https://labor.maryland.gov/labor/build/buildmobilehud.shtml 
  9. Manufactured Housing Institute. (2024). Manufactured Home Plant List. Accessed at https://www.manufacturedhousing.org/wp-content/uploads/2024/09/Plant-List-7_3_24.pdf 
Read More

TOD Preemption Passes the Legislature

Written by Nick Finio, Associate Director of the National Center for Smart Growth and Associate Research Professor at the University of Maryland, and Natalie Roach, Policy Associate at the National Center for Smart Growth.

~

At the close of the 2026 legislative session, the Maryland legislature passed the Transit and Housing Opportunity Act (HB 894). This bill was one of several successful elements of Gov. Moore’s housing package, and other pro-housing bills passed this year.

The Transit and Housing Opportunity Act has several main components which will impact the future of transit-oriented development across the state. With the bill, the state government wrests control over some aspects of land use from local governments near certain rail transit stations. Specifically, all WMATA heavy rail lines in MD, the MTA Purple Line, the Baltimore/MTA Light Rail and Metro, and the MARC Penn (between New Carrollton and Baltimore Penn Station) line are impacted. These lines are identified via a provision that a rail transit station must receive at least hourly service on average between 8am and 6pm on weekdays. Conceivably, in the future, other rail transit lines with currently less frequent service (e.g. the MARC Camden Line) could have frequency upgraded, and therefore be impacted by the bill.

Parking Minimums

The Act preempts local control of off-street parking requirements near rail transit by banning them in certain circumstances. Specifically, off-street parking minimums are now banned in new residential and mixed-use developments within 0.25 miles of rail stations. There is an exception  carved out to this if the local government has performed a parking study.

Mixed-Use Development

In perhaps the most striking piece of the legislation, the state Act has preempted some local control of land use within one half mile of a rail station. Zoning regulations within the half mile buffer now “shall allow mixed-use development on land designated for residential use or appropriate commercial use for mixed-use development.”  This preemption is designed to catalyze development of mixed-use development, which the bill defines as “any combination of a residential use with a recreational, office, dining, or retail use.”

The Act notably exempts areas currently zoned as single-family residential. Despite this exemption, the Act will impact numerous parcels currently zoned for only multifamily residential use near transit stations throughout the State. The Act will also impact any parcels currently zoned for light-industrial uses.

For example, near the University of Maryland, the City of College Park in Prince George’s County has numerous residential parcels zoned RMF-20 within the ½ mile buffer of the College Park Metro station on the green line. This zoning currently only allows residential multifamily development. Density, setbacks, and other regulations on new development on these parcels is still controlled by Prince George’s County, but any new development must allow a mix of residential and commercial uses. Conceivably, small apartment buildings on these lots could now have ground floor shops and restaurants in future development or redevelopment scenarios.

Map that shows residential parcels near the College Park Metro Station.

State-Owned Land

The Act also treats certain parcels of state-owned, and WMATA-owned, land that are “contiguous” to rail transit stations uniquely. The parcels must currently be “in use for a transportation purpose,” which we interpret to include parking lots, roads, kiss-and-ride lots, and potentially other uses. On these parcels, local governments may not impose any limitations or restrictions on land use classifications (e.g. zoning). Further, local governments cannot impose any restrictions on height or setbacks (or any “similar requirements” per the bill) for new developments. These provisions are subject to one caveat: the land and development project must be part of an approved transit-oriented development plan coordinated by MDOT and the local government.

For example, WMATA owns several parcels immediately contiguous to the Shady Grove WMATA station on the Red Line in Montgomery County. These parcels have existing height and other requirements that are set by the County’s zoning code, which could now potentially be overridden, underneath a new TOD plan for the area. Numerous other examples exist at rail stations across the state – either on WMATA owned or State-owned land. To understand how this framework could be applied across the state, look to the recent efforts by MDOT to develop a TOD strategy for Baltimore and a specific metro station parking lot in Baltimore City.

TOD Designation

HB 894 also continues to build out the newly updated Maryland transit-oriented development (TOD) designation process. In 2023, the Equitable and Inclusive Transit-Oriented Development Enhancement Act (HB12/SB151) launched the new process for TOD Designation. This included establishing an online application process, a 10 year expiration date on TOD designated sites, and making the Sustainable Growth Subcabinet responsible for issuing approvals. HB12 kickstarted a new focus on TOD designation at the state level. HB 894 expands the benefits of designation; with this Act, sites designated under the program (that meet specific requirements) are automatically considered Enterprise Zones. 

The TOD designation is a valuable tool for growing a transit-oriented community. The goal of the program is to facilitate transit-oriented development in key areas and reward localities that are working to advance TOD. When a site is given a TOD designation, it gains access to MDOT’s TOD Capital Grant and Revolving Loan Fund. It also gives projects within site boundaries priority in state applications; the Low Income Housing Tax Credit program under the Maryland Department of Housing and Community Development’s (DHCD) and requests to lease or purchase office or laboratory space with the Department of General Services and MDOT both rewards extra points to applications within TOD designated sites. 

There are currently 18 TOD designated sites in the state of Maryland. This updated process will allow for a new wave of locations across the state to be designated as TOD sites and receive the consequent benefits. There are many communities near transit that would benefit from a TOD designation. For example, only one station along the incoming Purple Line – New Carrollton – has received a state TOD designation. As the Purple Line brings changes to the neighborhoods it runs through, access to additional funding and prioritization from the state would allow localities to ensure benefits for Purple Line communities and to work towards an equitable, multimodal future.

Conclusion

In one fell swoop, the state legislature and governor have dramatically increased the potential for TOD near rail transit across the state. In future work, NCSG hopes to quantify the potential impacts of this bill. You can explore how this bill will potentially impact land across the state, especially state owned land, via NCSG’s web mapping tool that was released in 2025. 

Read More